Building Your First Waterfall & Frequency Plot
The purpose of this tutorial is to confirm your host setup, and use your Per Vices Crimson TNG as a signal source and receiver to pass data to a waterfall & frequency plot.
In this tutorial, we will cover:
- Prerequisites: Ensuring Background Knowledge
- Part 1: Preparation for Making Program
- Part 2: Creating Your First Waterfall and Frequency Plot using GNU Radio
- Part 4: Extending The Waterfall & Frequency Plot to Different and Multiple Channels
You can also find the completed waterfall & frequency plot GNU Radio script here.
Prerequisites: Ensuring Background Knowledge
This tutorial assumes you have already set up your Crimson TNG and configured your network. If you have not done so, you can reference the following how tutorials:
- Information on how to physically set up your unit can be found at Per Vices How To 1.
- Information on how to configure your network can be found Per Vices How to 2.
These must be properly set up to test your device.
Part 1: Preparation for Making Program
1.1 Setting up Loop Back
CAUTION: Ensure the use of SMA connector with 30dB attenuation to ensure safe operation of the Crimson TNG
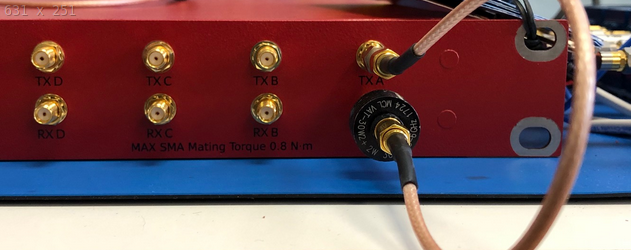
The signal test you will make is for when Tx ports communicating directly to the Rx ports, so you must connect them to each other with the SMA connector. This will test the functionality of transmitting and receiving in one program. Connect Tx-A to Rx-A, like pictured below.
Figure 1: implementing external SMA loop back from Rx-A to Tx-A using an SMA connector with 30dB attenuator
This set up is known as “loop back”. Later in the tutorial, you may want to add more to test multiple ports at once.
1.2 Getting Familiar with GNU Radio Software
GNU Radio is a software that uses drag and drop programming, allowing users to easily prototype their software defined radio systems (SDRs). GNU Radio utilizes a Graphical User Interface (GUI) for your programs, which enables you to control the visuals of your program in an easy manner. To complete the Waterfall and Frequency Plot, it is recommended you go through the GNU Radio’s tutorials to ensure comfort with the program as this tutorial utilizes the software.
Complete Introducing GNU Radio and Flow graph Fundamentals at the following link.
This wiki is up kept by the GNU Radio creators and is a great source if you ever need a stronger understanding of GNU Radio’s functions.
Part 2: Creating Your First Waterfall and Frequency Plot using GNU Radio
You will now start actually creating the flowchart program to test your Crimson TNG. The waterfall & frequency plot will require the following two flow block diagrams: a signal generator sink and a waterfall & frequency sink.
2.1. Launching GNU Radio
Launch the GNU Radio software to begin the creation of your first waterfall and frequency plot. GNU Radio uses drag and drop programming, allowing users to easily prototype their software defined radio systems (SDRs). Each block in this software represents a signal processing function, so your finished program will be a flowchart of functions that connects to the external Crimson TNG hardware.
GNU Radio utilizes a Graphical User Interface (GUI) for your workspace and your programs. Any block that has “GUI” in the title is referring to a function that will add a visual representation to your pop-up window, or GUI, when the code is run.
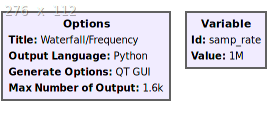
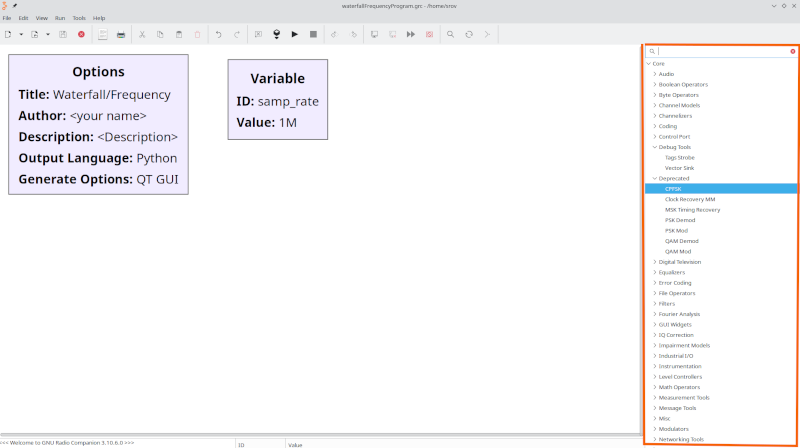
When you open up a new project in GNU Radio, you will have two blocks: an Options and a Variable block.
Figure 2: Default Blocks
Double-click on the Options block, and do the following:
Figure 3: Properties of Options
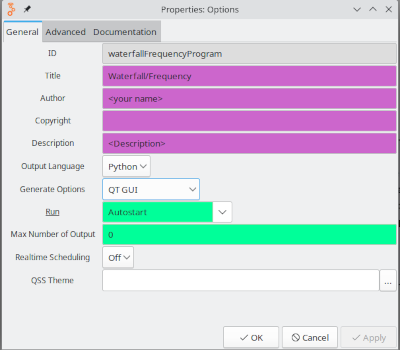
- Make the Title “Waterfall/Frequency”, and type an Author and Description in the appropriate fields if you choose. You may leave Id the same.
- The Title will show up at the top of your GUI window
- The Id is how you would reference this program through other programs, but you will not be doing this right now
- The Author and Description are for organizational purposes
Similarly, double-click on the Variable block and change the following:
Figure 4: Properties of Variables
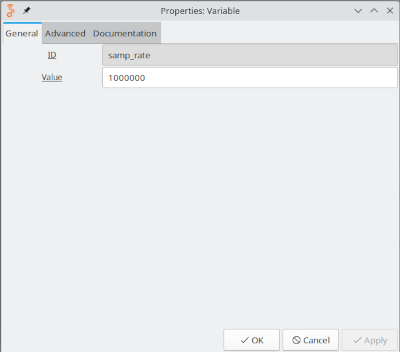
- Make the Id “samp_rate”, and set the Value parameter to a sample rate of 1e6 (1,000,000)
- The Id in this scenario is more important as you will be referencing this variable in your program. The sample rate variable is a base for many of the other function blocks, so ensure you always have this variable in your program
- The Value is self-explanatory
At this point it would be wise to save this file. You can it CTRL-S or click on file>save on the top left of the window. The name you choose for the file is not relevant to the Title or *Id. If you don’t save now, the application will prompt you to save your file before compiling your code, but it’s good practice to frequently save.
2.2 Signal Generator Sink
Finding Blocks
You will now start constructing the flow chart, forming the basis of the waterfall & frequency plot. The easiest way to place blocks is to grab and drag from the list of blocks on the right-hand side of GNU Radio’s interface Figure 5. Using CTRL-F opens a search bar at the top of the block list, which can help you find the blocks you need in a faster manner.
Figure 5: GNU Radio List of Blocks/Search Function
Signal Source
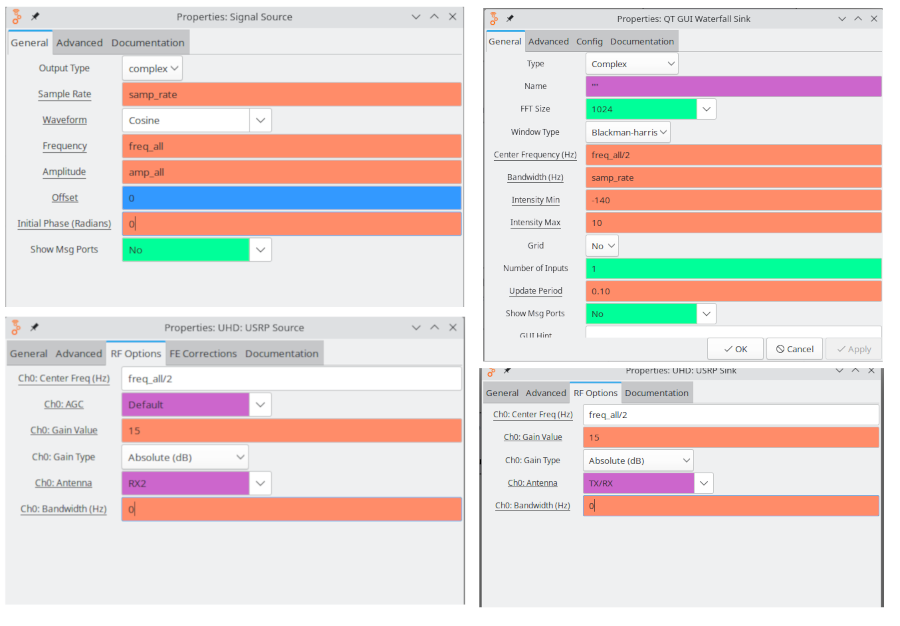
To start, find a Signal Source block, which sends out signals to be transmitted by your Crimson TNG. Double click on the block and ensure the properties match figure 8.
Figure 6: Properties of Signal Source
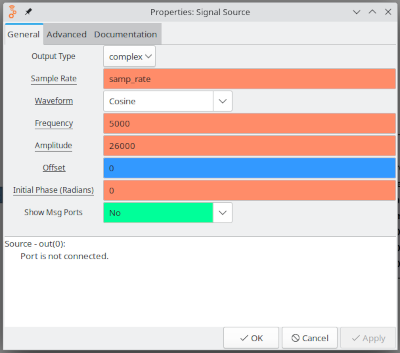
Notice how the Sample Rate doesn’t contain a value, but references the samp_rate variable. For now, the Frequency and Amplitude* are arbitrary. Later, you will turn these into variables.
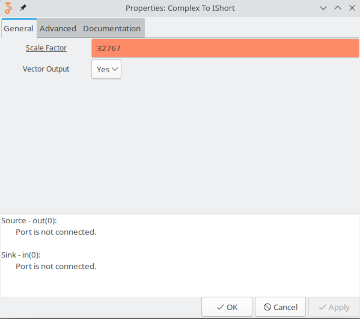
Complex to IShort
Next, you will need an Complex to IShort block. The function of this block is self explanatory. Ensure the Vector Output and Scale Factor match the image below. This scaling factor is recommended by the GNU program when working with signed voltage and a 16-bit output.
Figure 7: Properties of Complex to IShort
UHD: URSP Sink
To finish the Signal Generator Sink, you will need a GUI sink block will act like a transmitter to a SDR and displays the signals it sends on the screen. The sink block you’ll use today is called the UHD: URSP Sink. You will have to use both the general and the RF Options tabs.
Figure 8: Properties of UHD: URSP Sink
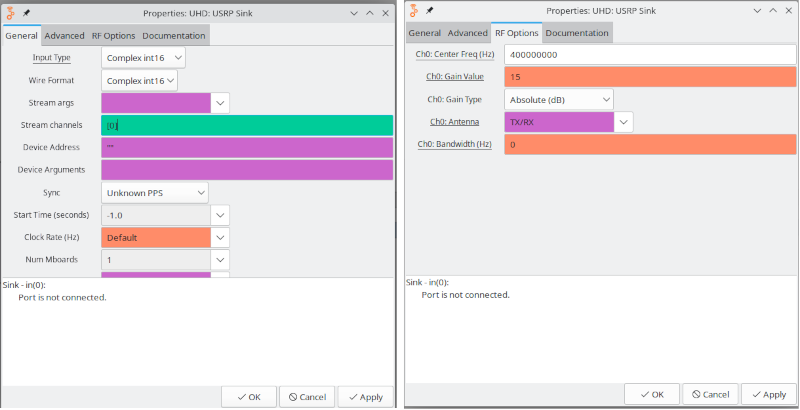
- For the UHD: USRP Sink block, change the Input Type parameter to Complex int16, set the Stream Channels to [0] in square brackets (i.e. Tx CH A), set the Wire Format to Complex int16, set the CH0: Center Freq (Hz) parameter to 400M, and set the CH0: Gain Value to 15.
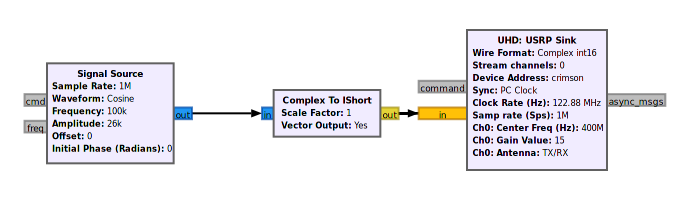
Completed Sink Flow Chart
The final signal generator sink flow chart should look like the following:
Figure 9: Signal Generator Sink
2.3 Waterfall and Frequency Sink
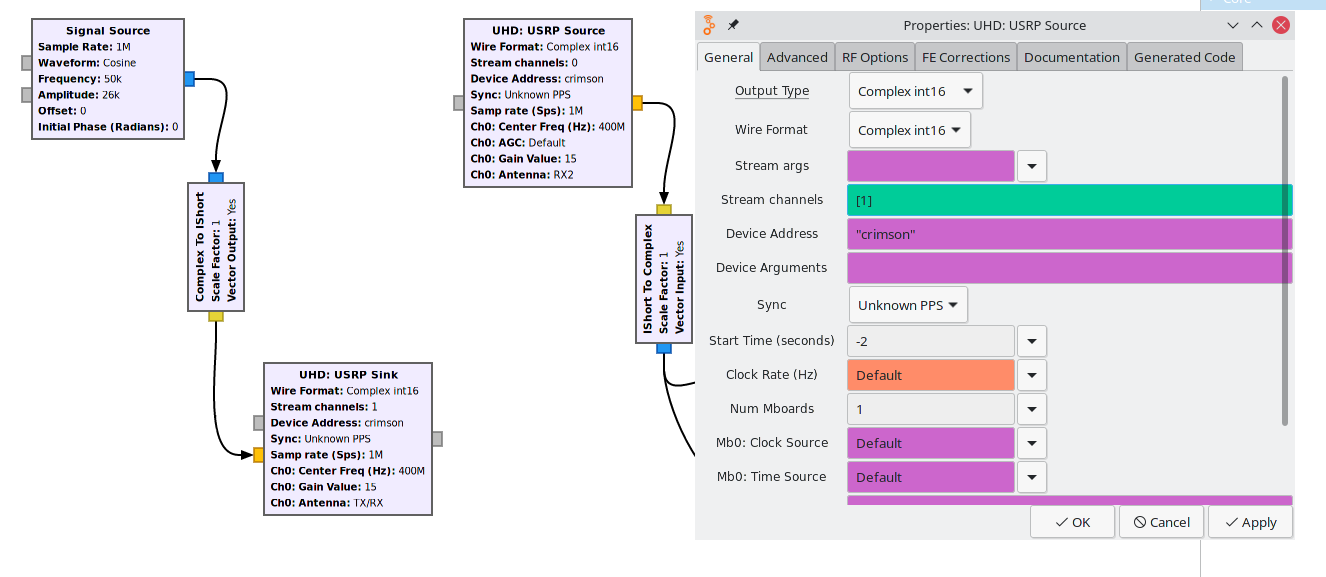
Second, we will construct the waterfall & frequency sink using blocks connected in following order: UHD: USRP Source, inputted to a IShort to Complex block, which is then inputted to a QT GUI Frequency Sink and QT GUI Waterfall Sink. Again, we will need to change a few parameters on these blocks:
UHD: USRP Source
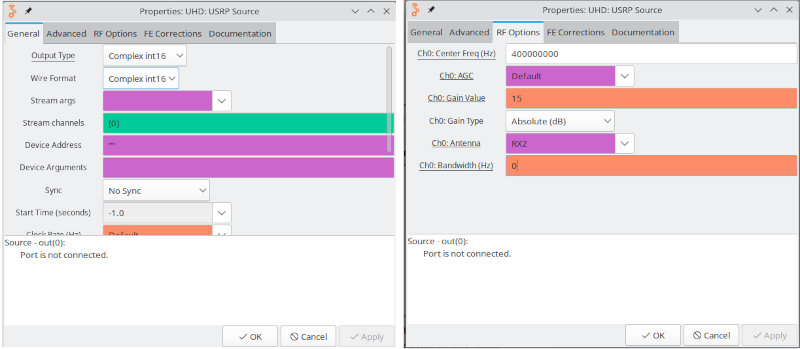
For the UHD: USRP Source block, change the Output type and Wire Format parameter to Complex int16, set the Stream Channels parameter to [0] in square brackets since we are using channels Tx-A and Rx-A, and set the Sample Rate, Ch0: Center Freq (Hz) and Ch0: Gain Value to the same values as the UHD: USRP Sink in the signal generator sink block diagram: Figure 10.
Figure 10: Properties of UHD: URSP Source
-
For the IShort to Complex, this will have the same values as the Complex To IShort in the signal generator sink block diagram.
-
The default parameters on the QT GUI Waterfall Sink and QT GUI Frequency Sink are fine for this project.
Completed Waterfall and Frequency Flow Chart
The figure below shows how the waterfall and frequency plot sink block flow chart should look on your screen.
Figure 10: Waterfall and Frequency Sink
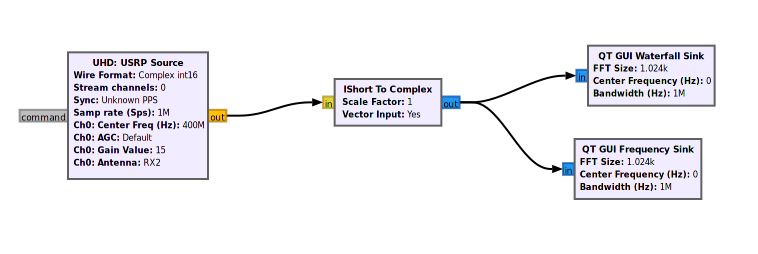
Notice how both GUI blocks connect to the output of the IShort to Complex block.
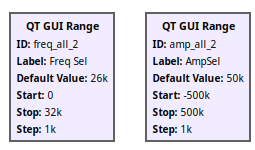
2.4 Variable Ranges
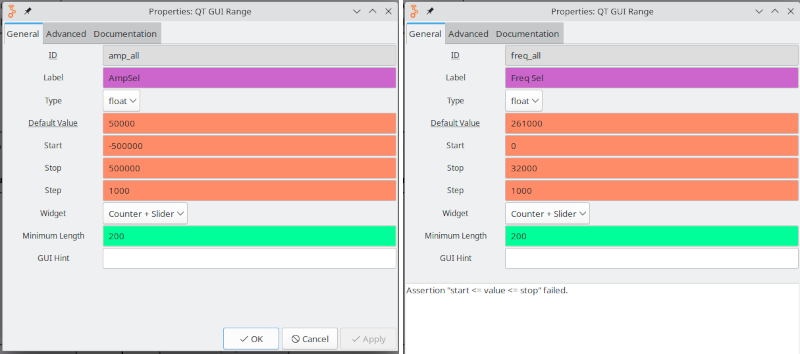
We also want to control the wave frequency and wave amplitude values of signal generator, along with the tuning frequency of the radio. This is accomplished using three QT GUI Range blocks.
- Create an QT GUI Range block, and set the ID to “sig_amp”, and the parameter values to:
- Default Value=10k, Start=0, Stop=32k, and Step=100.
- Create an QT GUI Range block, and set the ID to “sig_freq”, and the parameter values to:
- Default Value=samp_rate/10, Start=0, Stop=samp_rate, and Step=100.
- Create an QT GUI Range block, and set the ID to “sdr_freq”, and the parameter values to:
- Default Value=15e6, Start=0, Stop=6e12, and Step=1e6.
Figure 11: Properties of GUI Ranges
The figure below shows how these ranges are referenced in the other signal functions:
Figure 12: Ranges Referenced
2.4 Running Your First GNU Radio Script
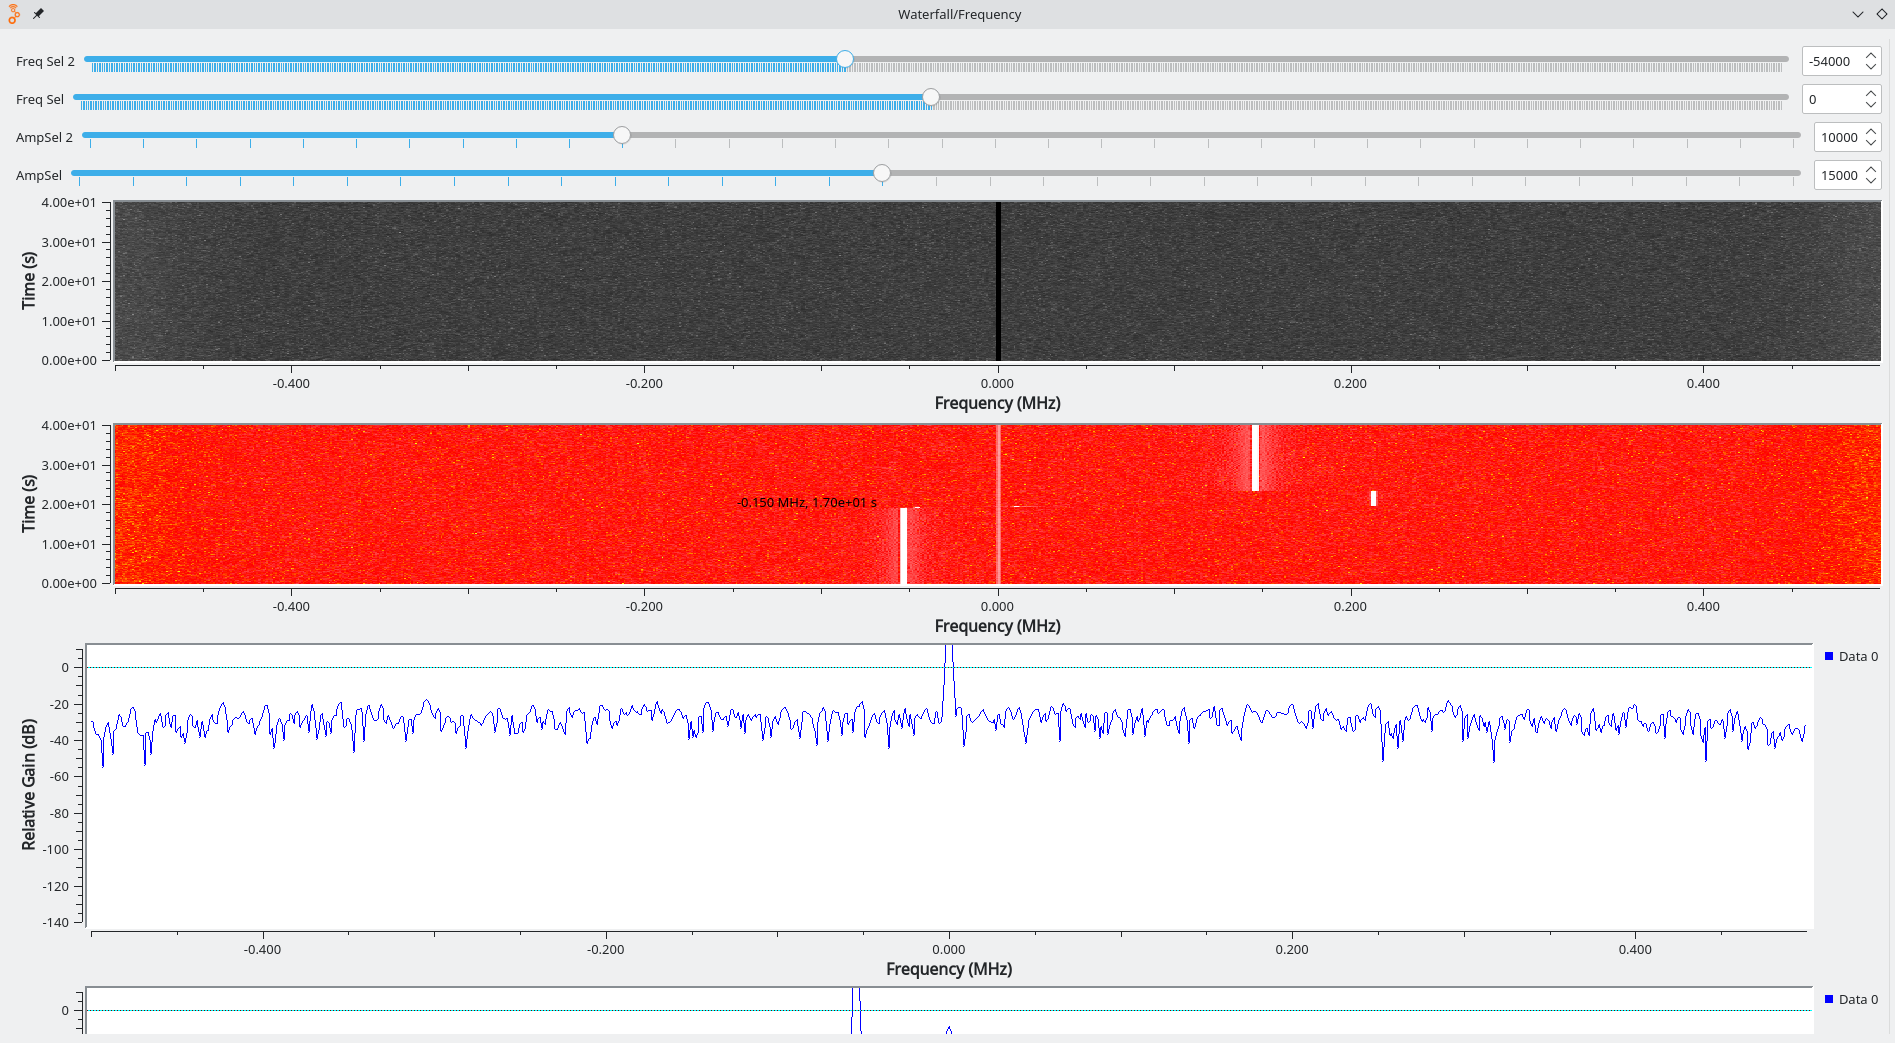
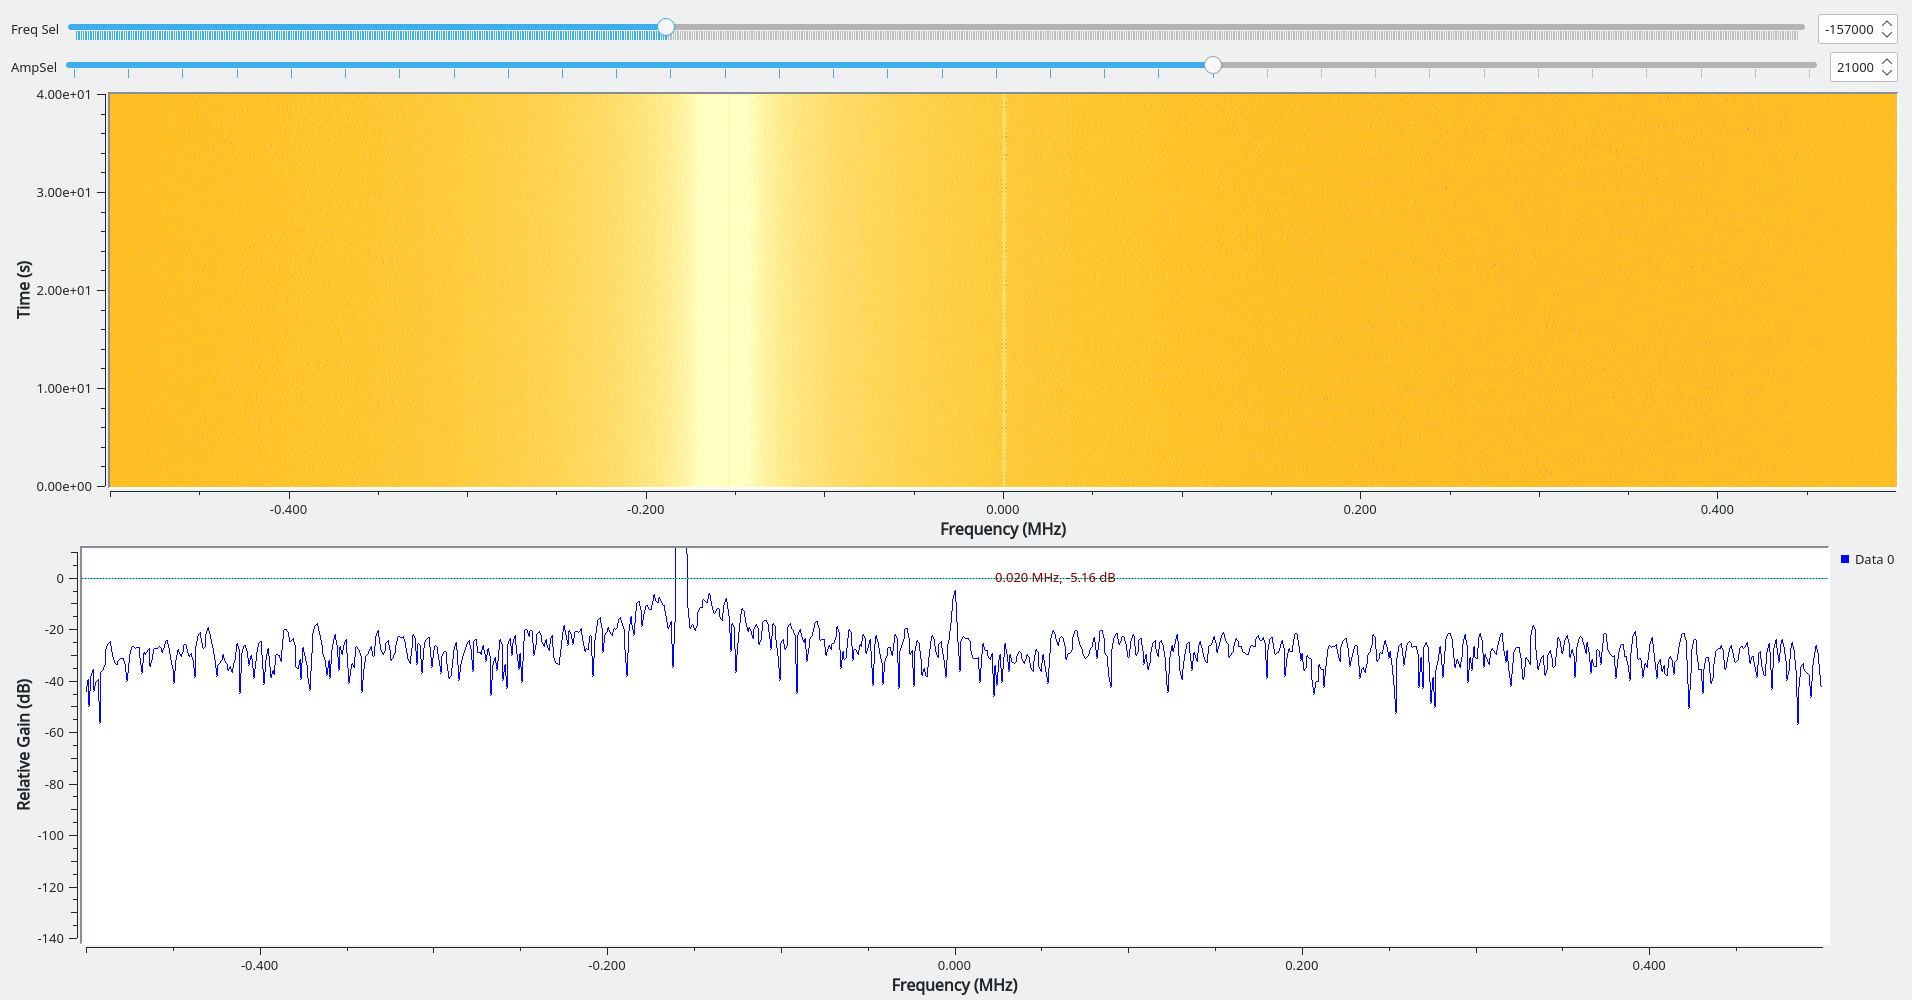
In order to run the code, save your work and then press the play button on the top of the interface screen. The program will run, and a new window should appear which shows your frequency slider, amplitude slider, waterfall sink plot, and frequency sink plot, as shown in Figure 13.
Figure 13: Window of your Waterfall and Frequency Plot
Note
By default, GNU Radio will automatically save a block prior to running it. You may want to make back-ups or use version control.
Part 3: Extending GNU Radio Script
You may also want to use your Crimson TNG on different channels or on multiple channels. Below we will go through how to perform a waterfall & frequency plot on a different channel and on multiple channels.
3.1. Channel Modification
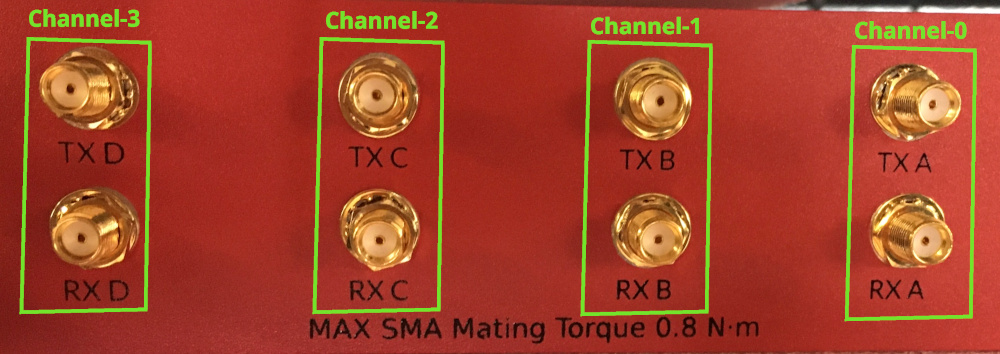
Crimson Channel Associations
The four channels on the Crimson unit are related to [0, 1, 2, 3], which you would refer to in the the properties of the function blocks.
Figure 14: Crimson Channel Associations (Rx and Tx)
Changing to Tx-B and Rx-B
To make your waterfall & frequency plot work on a different channel, you simply need to move the SMA connector with 30dB attenuator external loop over to channels Tx-B and Rx-B, shown in Figure 10 and change the stream channels parameter in the UHD: USRP Source and UHD: USRP Sink block to [1], as shown below in Figure 11.
Figure 10: Changing Crimson External SMA connector to Tx-B and Rx-B
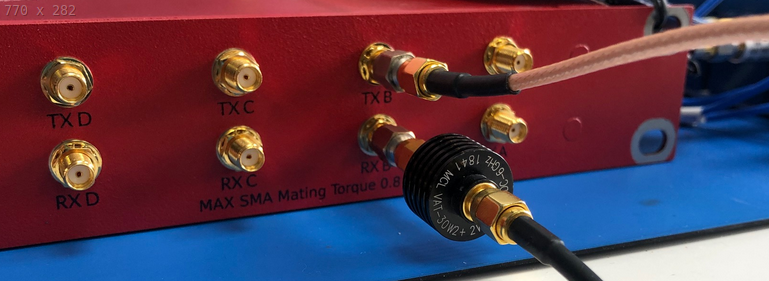
Figure 11: Using a Different Stream Channel in GNU Radio
You should now be able to run this the same as you did before and see a similar new window appear.
3.2 Using Multiple Channels
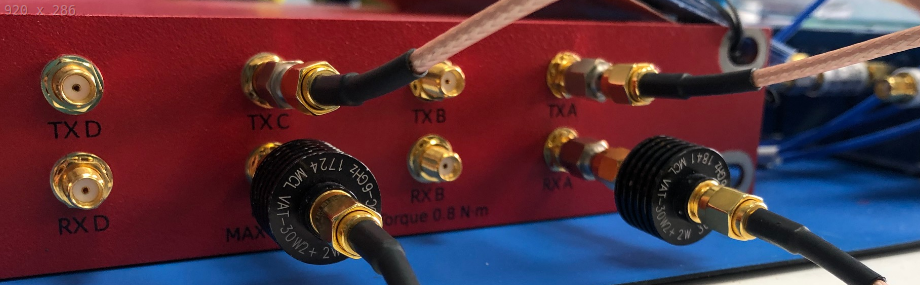
Now we are going to make our GNU Radio script waterfall & frequency plot sink work using two channels; the Tx-A & Rx-A and Tx-C & Rx-C. We need to use two SMA connectors now to make an external loop for each channel, shown in Figure 11 below.
Figure 12: Multi-channel (Tx-A/Rx-A and Tx-C/Rx-C) external SMA Loops
Duplicating the Signal Generator Sink Flow Chart
Start setting up your second channel by copying and pasting your GUI Range blocks. GNU Radio will auto update their Ids, but you are welcome to set them to whatever name is easiest for you. Theoretically, you could have two UHD: USRP Sink blocks receiving input from the same output, but for this project you will have four range controls. Two per Signal Source Block.
Figure 13: Second Set of GUI Ranges
Next, we will need to duplicate the signal generator sink block diagram shown in Figure 9. We can easily select multiple blocks by holding CTRL and clicking the relevant blocks, followed by copying and pasting. You will now have two block diagrams composed of a Signal Source to Complex to IShort to UHD:USRP Sink: one block diagram which we will allocate to Tx-A/Rx-A and the other to Tx-C/Rx-C. We will need to make the following parameter changes to use multiple channels:
Figure 14: Second Signal Generator Properties
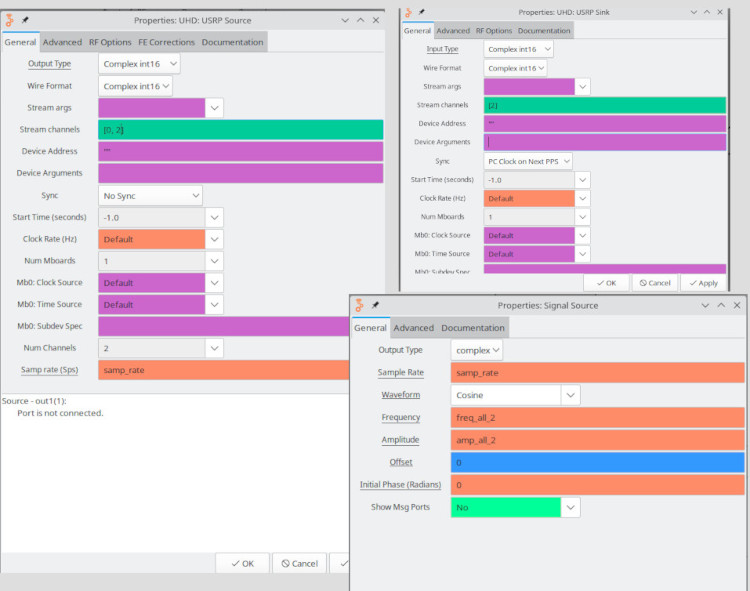
- Click on both the UHD:USRP Sink blocks, and assign one block’s Stream Channel parameter to [0] (i.e.Tx-A) and the other block’s Stream Channel parameter to [2] (i.e.Tx-C).
- Change the UHD: USRP Source Stream Channels parameter to [0,2], indicating that we want to be able to output and control two channels on two separate QT GUI Waterfall Sink and QT GUI Frequency Sink blocks.
- Set Num Channels parameter in the USRP Source to “2”, so that we have two outputs on the block. We are then able to route each output channel to a Complex to Ishort and then to a QT GUI Waterfall Sink and QT GUI Frequency Sink.
- We also need to ensure that our Center Freq parameter matches with the signal generator block’s UHD:USRP Sink.
- To control the frequency and amplitude of each channel, we will also need to make another two GUI Range blocks, and ensure the Id parameter of each of these matches what is found on each Signal Source block under Frequency and Amplitude.
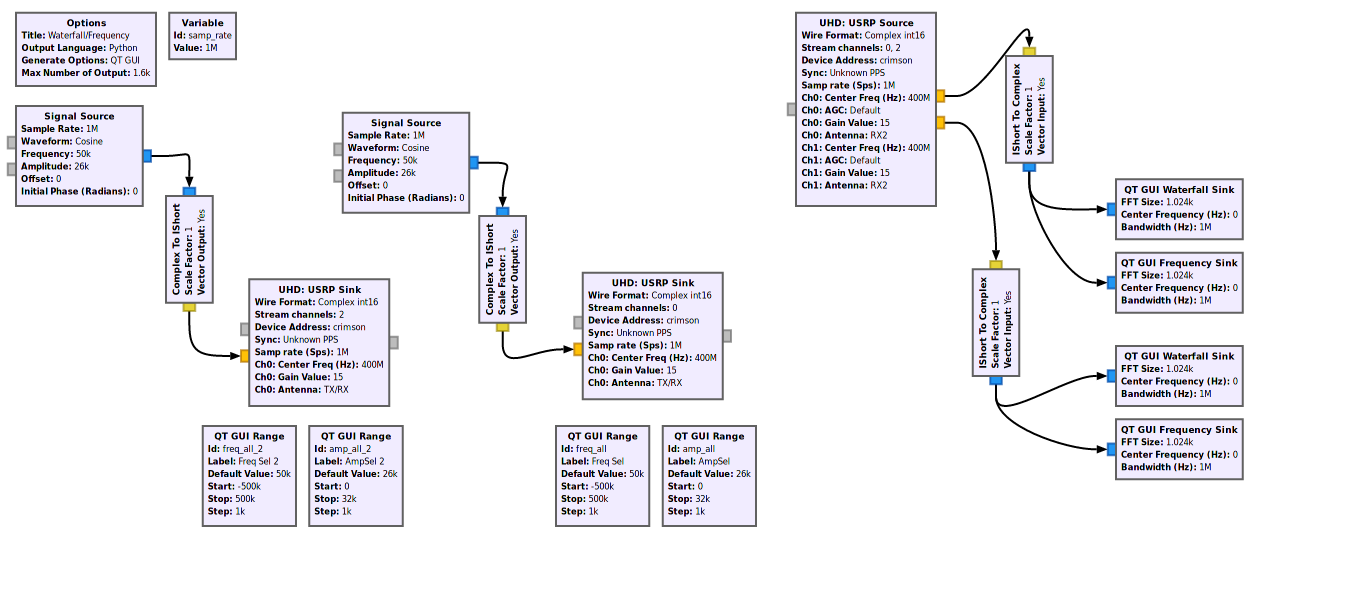
The entire block diagram should be similar to what is shown in the Figure 13 below.
Figure 15: Multi-channel Waterfall and Frequency Block Diagram
Finally, you can run the GNU Radio script and your output should produce two frequency and water plots, one for each channel, similar to what we had in 3.4.
Note
You can also double-click on the QT GUI Waterfall Sink, go into the “Config tab” and change the Line One Color parameter to get different color schemes for your plots.
You should now have something similar to Figure 14 shown below.
Figure 16: Multi-channel Waterfall and Frequency Plot