Performance Measurements
Phase Noise Profiles and Spectrum Graphs
Reference Clock
Test Conditions
The Ref Clock is configured with an internal 10 MHz reference. A 50R cable was used to connect Cyan to a Rhode and Swartz FSW Signal and Spectrum Analyzer where we captured the results.
Measurement Results
Figure 1: Phase Noise Profile of Reference Clock

Figure 2: Spectrum of Reference Clock

Device Clock
Test Conditions
The Dev Clock used for converters, operates at 250MHz (Configured with internal 10MHz reference). A 50R cable was used to connect Cyan to a Rhode and Swartz FSW Signal and Spectrum Analyzer where we captured the results.
Measurement Results
Figure 3: Phase Noise Profile of Dev Clock

Figure 4: Spectrum of Dev Clock

Tx Waveform Performance Measurements
Note on Phase Noise
Note
PHASE NOISE MEASUREMENTS: The following phase noise measurements were taken using the default 10MHz PDF, which provides for a default RF frequency tuning step size of 10MHz. This decision was made to support the widest possible use cases from our customers. However, these measurements do not reflect the best possible performance of our product; for phase noise sensitive applications, the phase noise profile can be improved by over 12dB. Please contact us for more information.
In this section, you will find the command to create the Normalized dBm Spectrum (SNR) plot shown, and a .pdf file of all phase noise and dynamic range measurements.
Test conditions
Measurements were taken using a Rhode and Swartz FSW Signal and Spectrum Analyzer. The RF port of the phase noise analyzer was connected to the Tx A port. Waveforms were generated using tx_waveforms, an example program that is included with libUHD, and run with the specified command options required to obtain a 0dBm output measurement.
Tx Measurements at 50 MHz
Normalized dBm Spectrum Command
When setting the command options below, the wave-freq, ch-freq, dp-freq, and dsp-freq must add up to the frequency you wish to measure.
sudo ./tx_waveforms \
  --rate 10000000 \
  --ampl 0.99 \
  --wave-type SINE \
  --wave-freq 10000 \
  --channels "0" \
  --ch-freq 9990000
  --dp-freq 39000000
  --dsp-freq 1000000
Measurement Package
Cyan 50MHz Tx Measurements: this includes phase noise and spectrum measurements for the above configuration.
Note
Phase noise measurements are based on standard 10MHz PDF. See note on phase noise.
Normalized dBM Spectrum (SNR)

Tx Measurements at 500 MHz
Normalized dBm Spectrum Command
When setting the command options below, the wave-freq, ch-freq, dp-freq, and dsp-freq must add up to the frequency you wish to measure.
sudo ./tx_waveforms \
  --rate 10000000 \
  --ampl 0.99 \
  --wave-type SINE \
  --wave-freq 100000 \
  --channels "0" \
  --ch-freq 9900000
  --dp-freq 489000000
  --dsp-freq 1000000
Measurement Package
Cyan 500MHz Tx Measurements: this includes phase noise and spectrum measurements for the above configuration.
Note
Phase noise measurements are based on standard 10MHz PDF. See note on phase noise.
Normalized dBM Spectrum (SNR)

Receive Performance Measurements
We provide two types of receive performance measurements that aim to provide generic data on the sensitivity and dynamic range of the radio.
For sensitivity, the product is configured for maximum gain, and an input signal of a constant and specified power is injected into the radio chain. This data is subsequently plotted in the frequency domain, and the peak value provided, along with an estimate for the noise floor, allowing you to infer the minimum detectable signal (MDS) for a particular frequency.
For dynamic range, the input power of the signal, and the gain of the SDR, are adjusted to provide a near-fullswing amplitude at the ADC, and the FFT is provided. This aims to provide you with a measurement of dynamic range.
Rx Sensitivity Measurements
The Rx sensitivity measurements is intended to provide a broadly applicable reference: for specific applications or requirements, performance can often be greatly improved.
These figures were taken with the following hardware parameters:
Table 1: Cyan Device Parameter Revision for Max Sensitivity
| Parameter | Revision |
|---|---|
| Hardware | Cyan TNG RTM5 |
| FPGA | a9bedd7f5 |
| Server | 5f2ad47a |
| MCU | 431168f4 (Rx/Time) |
| UHD | 62a1418f |
The device was configured for maximum gain, using the following parameters:
Table 2: Cyan Rx Max Sensitivity Measurement Parameters
| Parameter | Value |
|---|---|
| Gain | 80 |
| Sample Rate | 25MSPS |
| FFT Size | 1024 |
| Input Power (BB) | -21.5 dBm |
| Input Power (RF) | -60 dBm |
The input power from the signal generator was measured using a spectrum analyzer and adjusted to be constant for each frequency (to account for cable losses, etc).
Test Conditions
The device was configured for maximum gain, minimum attenuation, and the output of a signal generator was connected to Rx A. This signal was processed using GNU Radio program.
Cyan Sensitivity Summary Results: Relative peak amplitude and normalized noise floor measurements.
| Input Frequency (GHz) | Input Power (dBm) | Peak Amplitude (dB) | Mean Noise Floor (dB) | Normalized Noise Floor (dBm) |
|---|---|---|---|---|
| 0.050 | -21.5 | 48.77 | 1 | -69.27 |
| 0.50 | -60.0 | 64.00 | 10.2 | -113.8 |
| 1.5 | -60.0 | 69.23 | 13 | -116.23 |
| 2.8 | -60.0 | 72.28 | 11.13 | -121.15 |
| 3.6 | -60.0 | 67.90 | 10.6 | -117.3 |
| 5.1 | -60.0 | 41.59 | 16.91 | -84.68 |
| 8.1 | -60.0 | 67.16 | 10 | -117.16 |
| 12.1 | -60.0 | 60.33 | 6.4 | -113.93 |
| 13.1 | -60.0 | 58.86 | 6 | -112.86 |
| 15.1 | -60.0 | 55.74 | 4.25 | -111.49 |
| 18.1 | -60.0 | 53.40 | 5 | -108.4 |
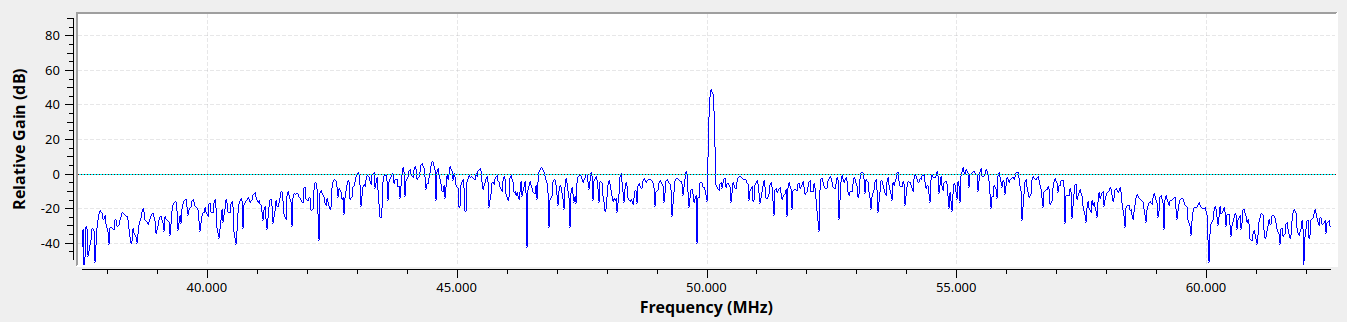
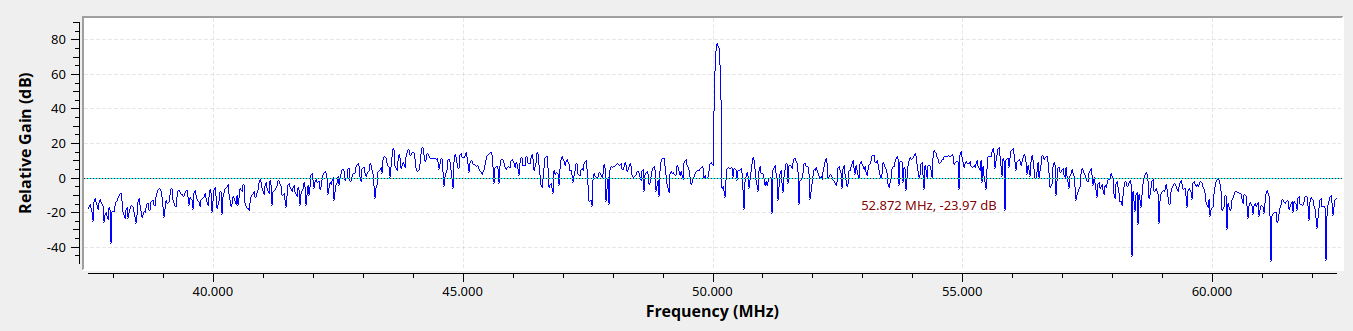
Rx Max Sensitivity at 50 MHz
Figure 11: Spectrum of 50 MHz Rx Waveform under Max Sensitivity conditions
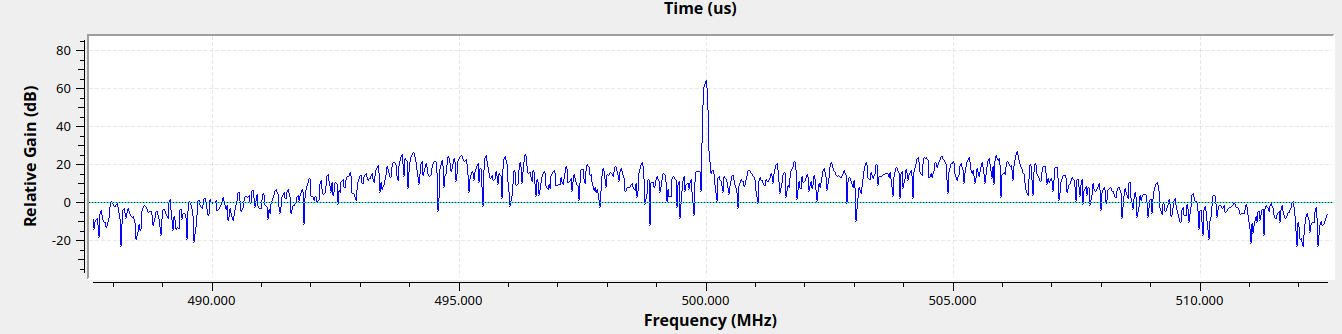
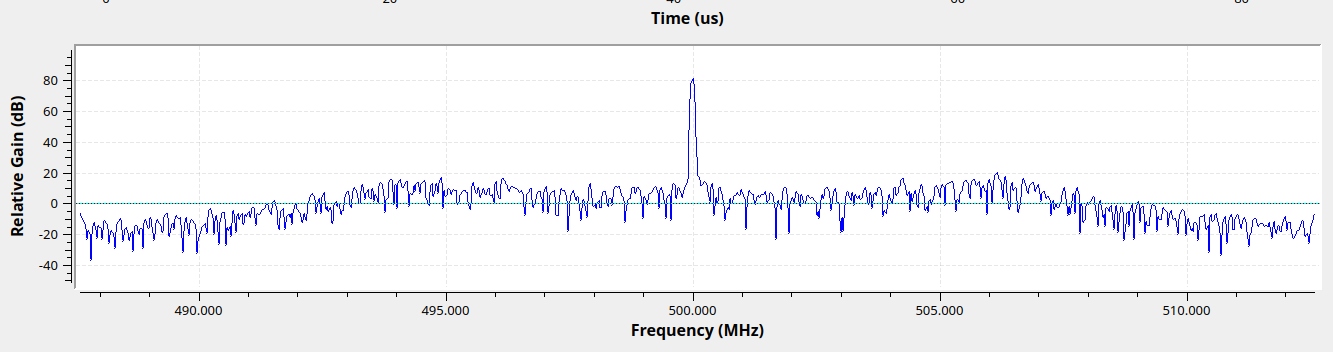
Rx Max Sensitivity at 500 MHz
Figure 12: Spectrum of 500 MHz Rx Waveform under Max Sensitivity conditions
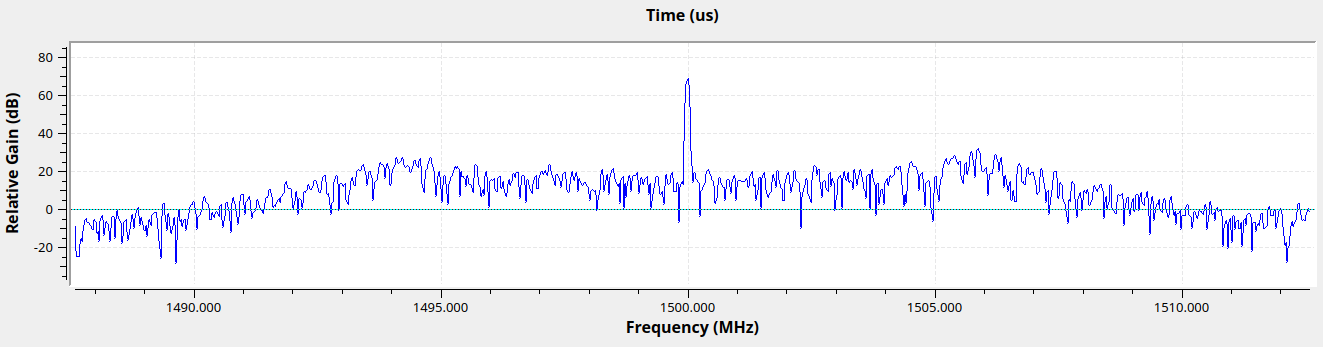
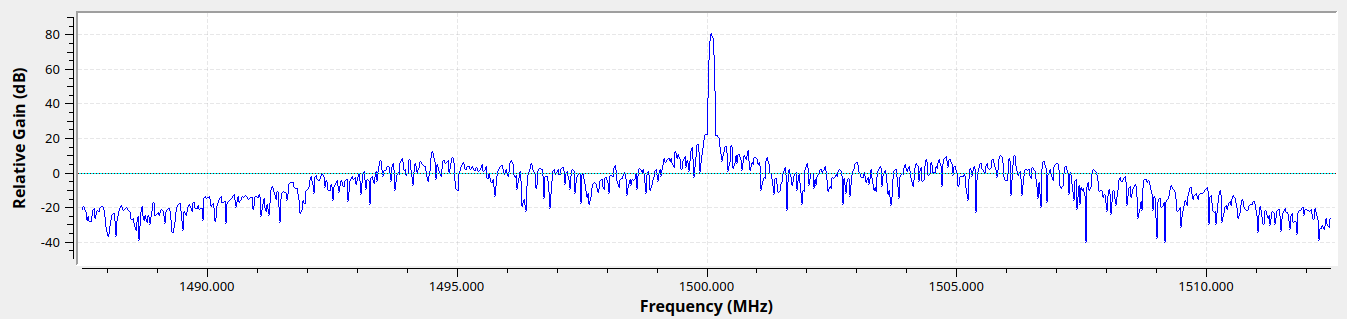
Rx Max Sensitivity at 1.5 GHz
Figure 13: Spectrum of 1500 MHz Rx Waveform under Max Sensitivity conditions
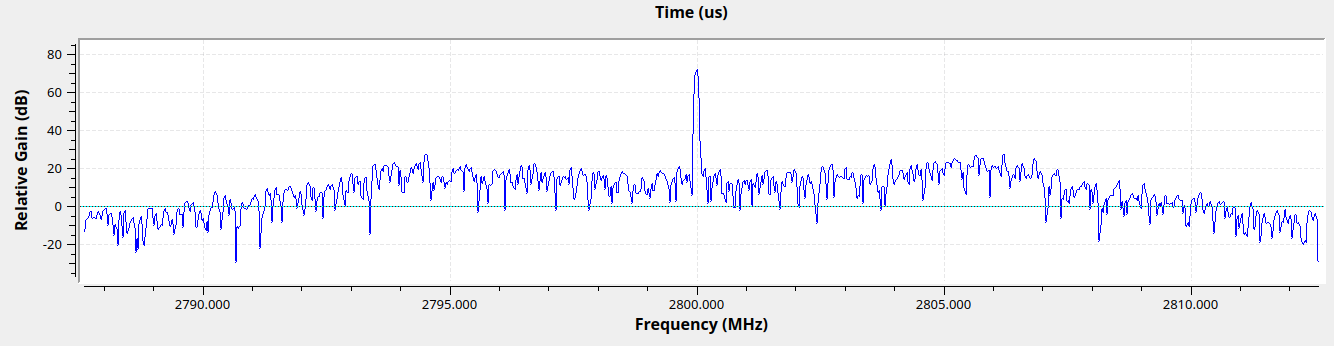
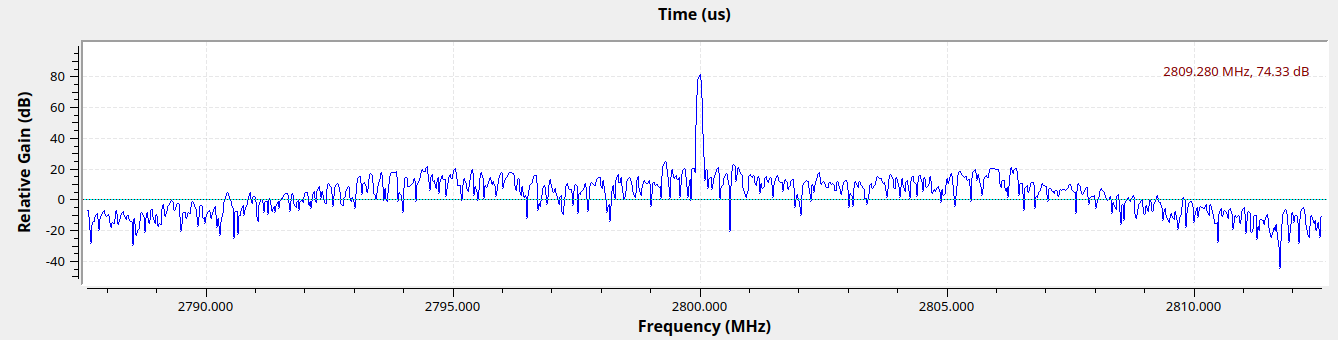
Rx Max Sensitivity at 2.8 GHz
Figure 14: Spectrum of 2800 MHz Rx Waveform under Max Sensitivity conditions
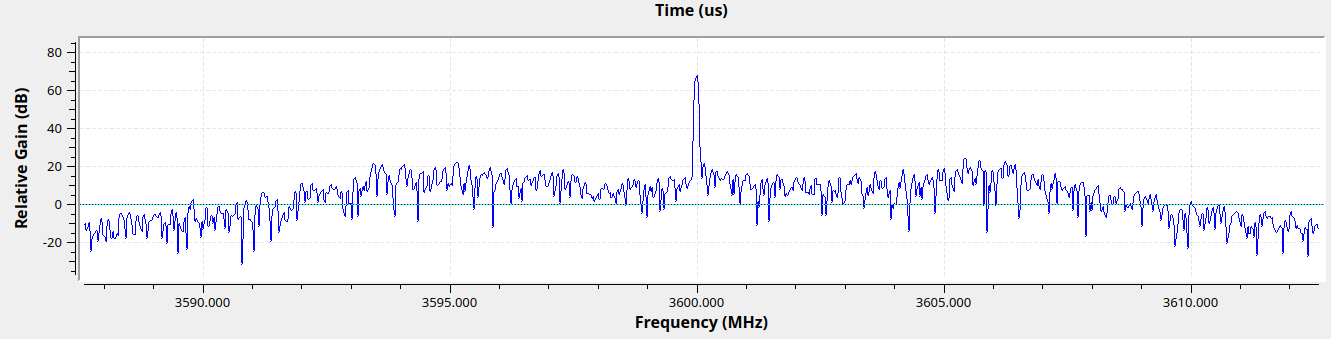
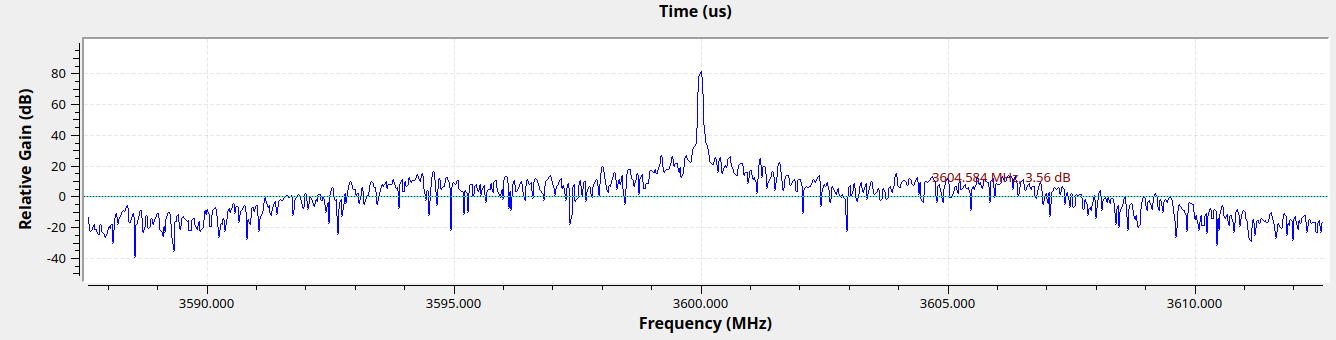
Rx Max Sensitivity at 3.6 GHz
Figure 15: Spectrum of 3600 MHz Rx Waveform under Max Sensitivity conditions
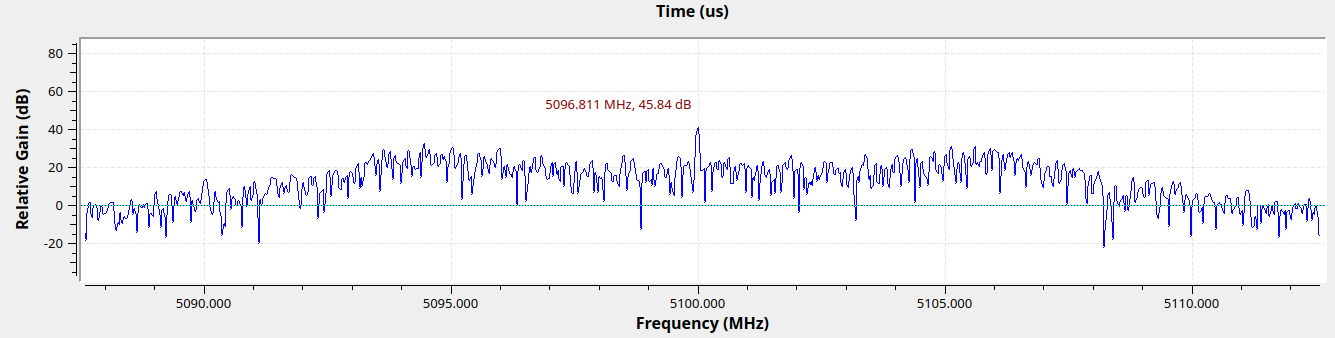
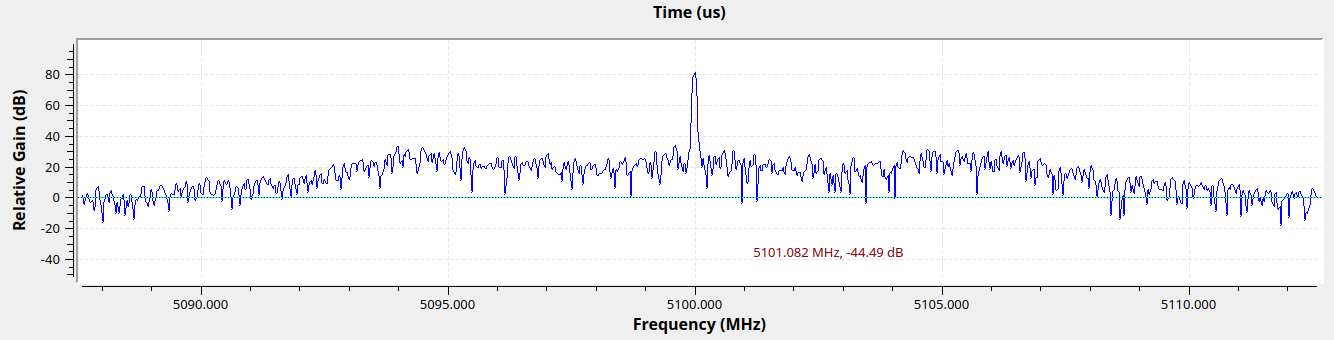
Rx Max Sensitivity at 5.1 GHz
Figure 16: Spectrum of 5100 MHz Rx Waveform under Max Sensitivity conditions
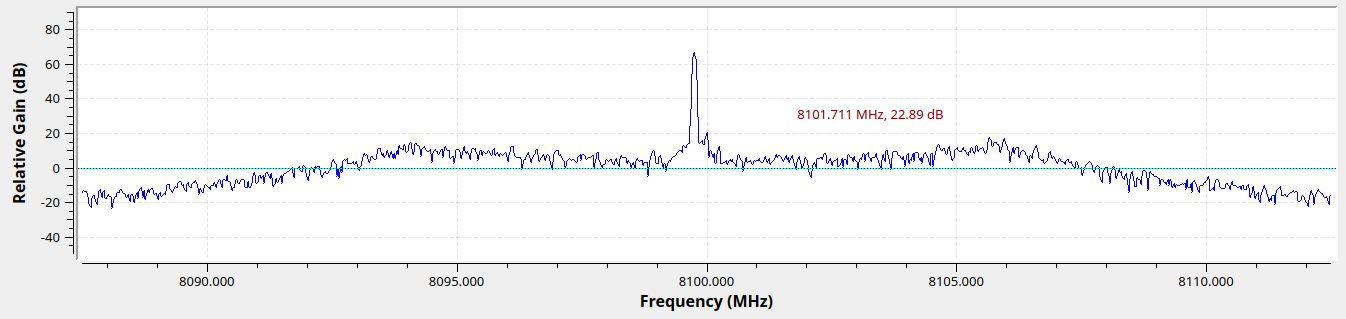
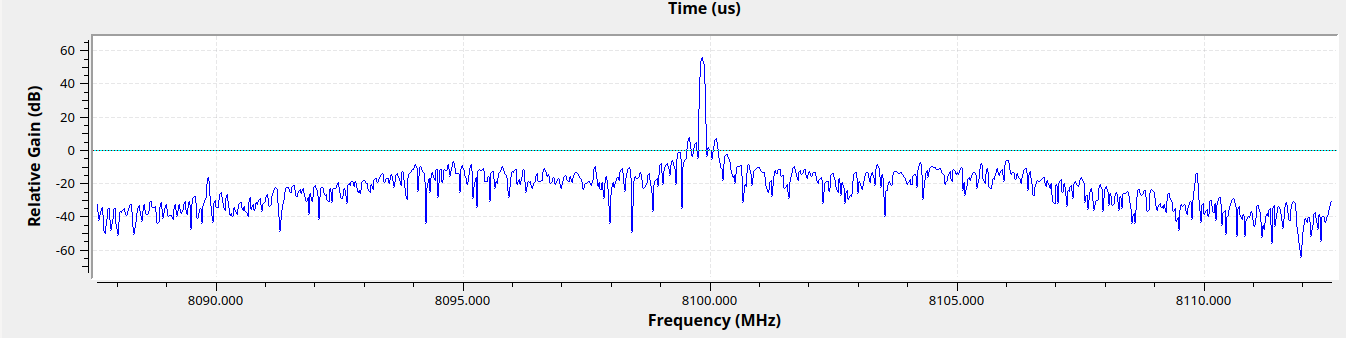
Rx Max Sensitivity at 8.1 GHz
Figure 17: Spectrum of 8100 MHz Rx Waveform under Max Sensitivity conditions
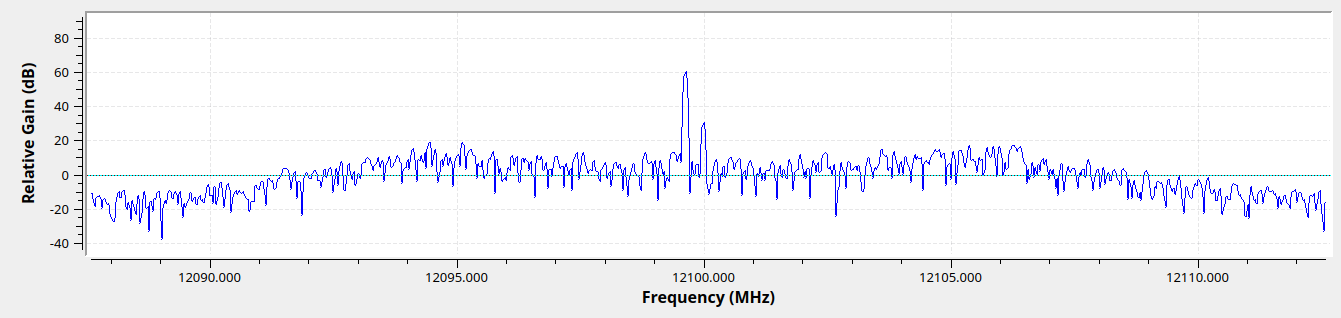
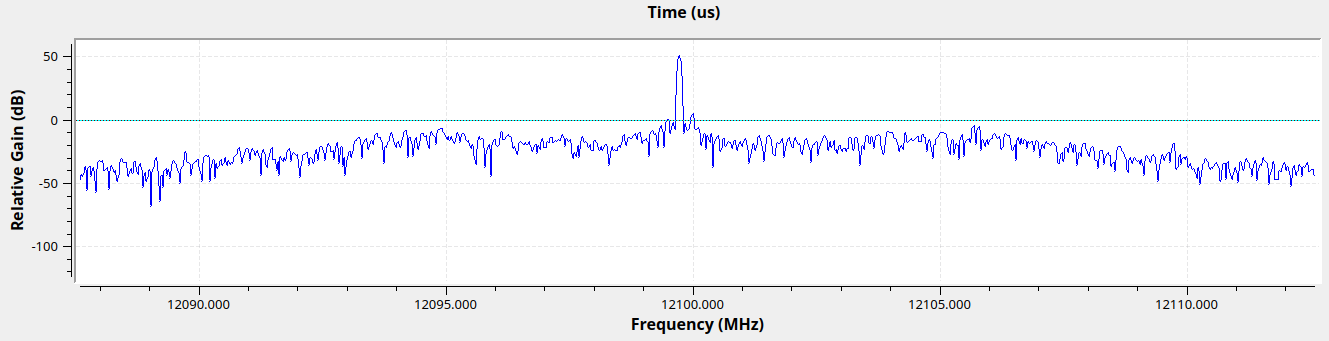
Rx Max Sensitivity at 12.1 GHz
Figure 18: Spectrum of 12100 MHz Rx Waveform under Max Sensitivity conditions
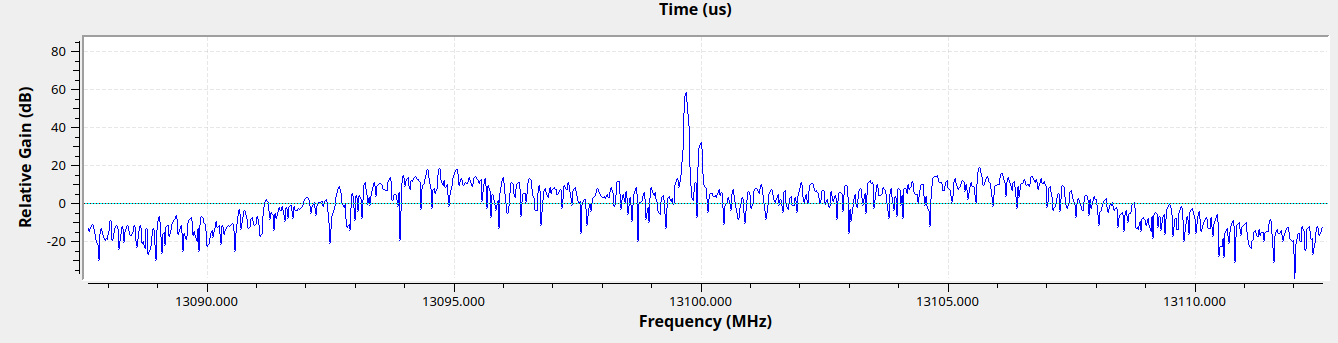
Rx Max Sensitivity at 13.1 GHz
Figure 19: Spectrum of 13100 MHz Rx Waveform under Max Sensitivity conditions
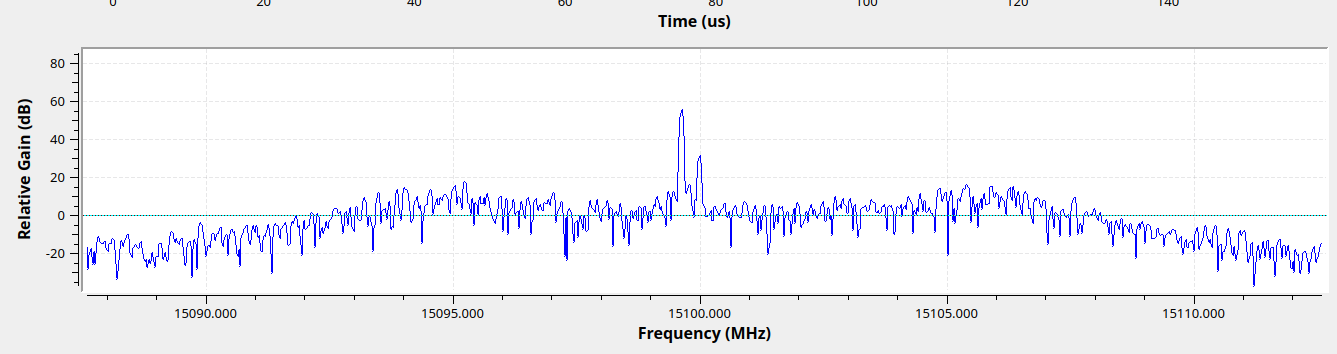
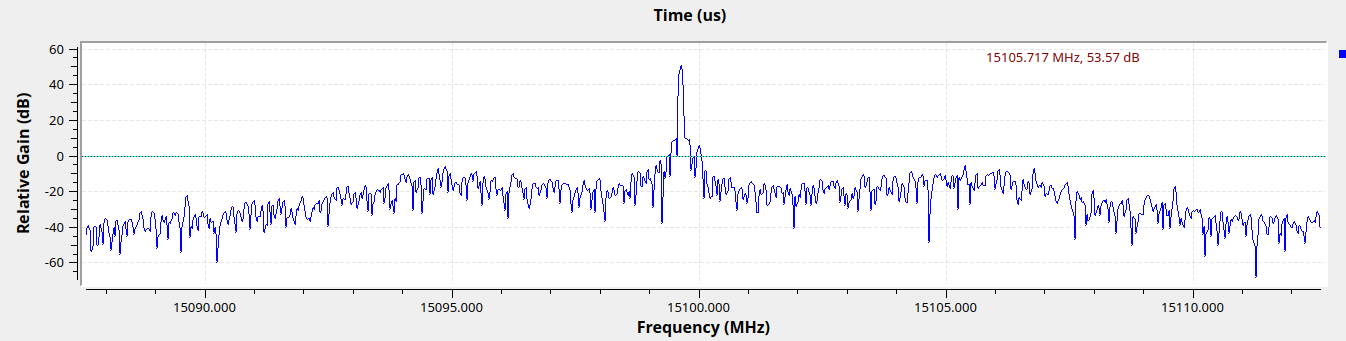
Rx Max Sensitivity at 15.1 GHz
Figure 20: Spectrum of 15100 MHz Rx Waveform under Max Sensitivity conditions
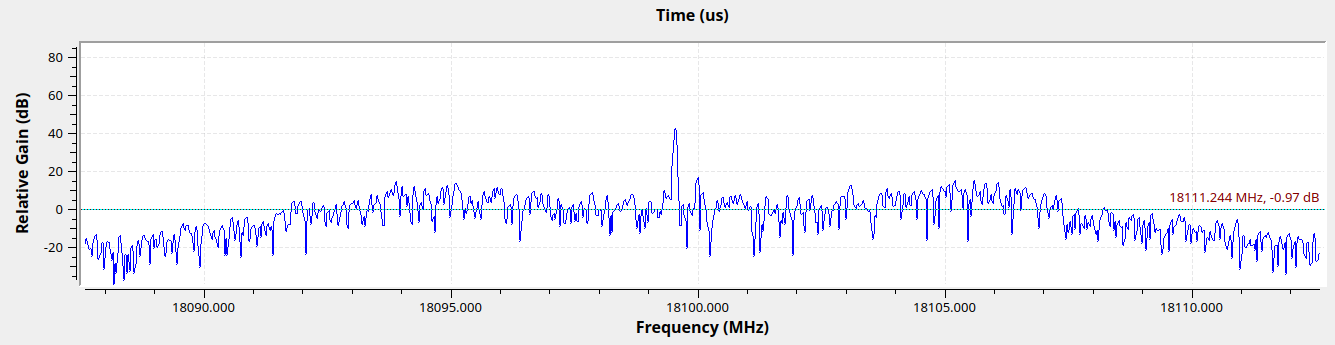
Rx Max Sensitivity at 18.1 GHz
Figure 21: Spectrum of 18100 MHz Rx Waveform under Max Sensitivity conditions
Rx Dynamic Range Measurements
Table 3: Crimson TNG Device Parameter Revision for Sensitivity
| Parameter | Revision |
|---|---|
| Hardware | Cyan TNG RTM5 |
| FPGA | a9bedd7f5 |
| Server | 5f2ad47a |
| MCU | 431168f4 (Rx/Time) |
| UHD | 62a1418f |
The following summary measurements were obtained for the receive channel dynamic range.
Table 4: Cyan Dynamic Range Measurement Parameters
| Input Frequency (GHz) | Input Power (dBm) | Rx Gain (dB) | Peak Amplitude (dB) | Noise Floor (dB) | Dynamic Range (dB) |
|---|---|---|---|---|---|
| 0.05 | -29.3 | 30 | 77.8 | 7.85 | 69.95 |
| 0.50 | -24.0 | 45 | 81.39 | 7.13 | 74.26 |
| 1.5 | -20.0 | 45 | 81.41 | 7.1 | 74.31 |
| 2.8 | -33.3 | 45 | 81.26 | 8.11 | 73.15 |
| 3.6 | -29.3 | 45 | 81.55 | 6.16 | 75.39 |
| 5.1 | -0.22 | 45 | 81.53 | 13.3 | 68.23 |
| 8.6 | -23.1 | 45 | 81.26 | 1.61 | 79.65 |
| 12.1 | -21.5 | 45 | 50 | -20 | 70 |
| 15.1 | -19.8 | 45 | 50.92 | -20 | 70.92 |
| 18.1 | 8.9 | 45 | 43.62 | -15 | 58.62 |
Test conditions
In the second setup, we generated signals at various frequencies on a signal generator and passed it into Rx Channel A on the Cyan.
The input power and rx channel gain were varied to provide full swing, where possible, with an FFT bin size of 1024.
Rx Dynamic Range at 50 MHz
Figure 22: Spectrum of 50 MHz Rx Waveform under Max Dynamic Range conditions
Rx Dynamic Range at 525 MHz
Figure 23: Spectrum of 525 MHz Rx Waveform under Max Dynamic Range conditions
Rx Dynamic Range at 1.5 GHz
Figure 24: Spectrum of 1500 MHz Rx Waveform under Max Dynamic Range conditions
Rx Dynamic Range at 2.8 GHz
Figure 25: Spectrum of 2800 MHz Rx Waveform under Max Dynamic Range conditions
Rx Dynamic Range at 3.6 GHz
Figure 26: Spectrum of 4200 MHz Rx Waveform under Max Dynamic Range conditions
Rx Dynamic Range at 5.1 GHz
Figure 27: Spectrum of 5100 MHz Rx Waveform under Max Dynamic Range conditions
Rx Dynamic Range at 8.1 GHz
Figure 28: Spectrum of 8100 MHz Rx Waveform under Max Dynamic Range conditions
Rx Dynamic Range at 12.1 GHz
Figure 29: Spectrum of 12100 MHz Rx Waveform under Max Dynamic Range conditions
Rx Dynamic Range at 15.1 GHz
Figure 30: Spectrum of 15100 MHz Rx Waveform under Max Dynamic Range conditions
Rx Dynamic Range at 18.1 GHz
Figure 31: Spectrum of 18100MHz Rx Waveform under Max Dynamic Range conditions
