Plotting IQ Data from GNU Radio in Python & GNU Octave
1. Introduction
The purpose of this application note is to provide a means of reading, parsing and plotting IQ data captured with GNU Radio (i.e., gr.file_sink) using a simple Python script or GNU Octave. The data which we use in the Python and GNU Octave scripts was captured from the GNU Radio program found in Application Note 11, and may be downloaded here. This datafile includes four channels of data, but we are only going to use channel A for this guide.
After downloading the tarball, you can use the following command to decompress the data;
tar -xf Crimson_0M0HzLO_14M85HzDSP_1MSPS_4Ch.tarAlternatively, you may also generate your own file for a 10MSPS capture, centered at 10MHz, with a 5dB gain, collected from channel 0, and saving to test-samples.dat:
/usr/lib/uhd/examples/rx_samples_to_file --rate 10000000 --nsamps 250000 --freq 10000000 --gain 5 --channel 0 --file test-samples.dat2. Plotting IQ Data in Python
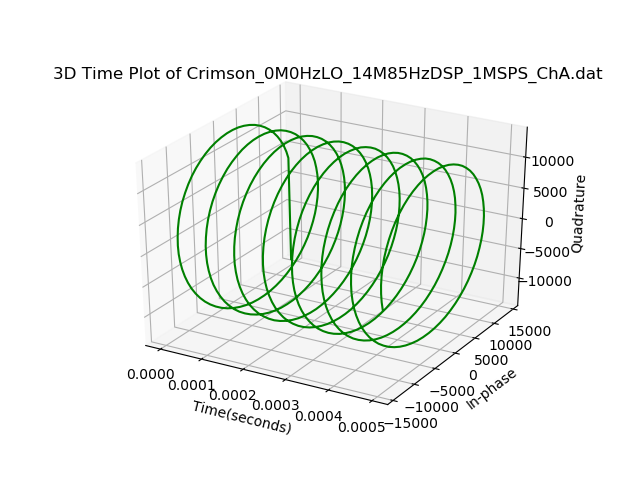
A script to separate the .dat file into IQ pairs and plot the data is found on our github page here. This is capable of separating a .dat file into in-phase and quadrature components, and plotting them IQ amplitude vs. samples or IQ Amplitude vs. time, as shown in Figure 1. It also allows you to view a .dat file in 3D, as shown in Figure 2.
Note
When using the Python script, you will need to manually input your .dat file directory as well as sample rate in which you used to capture data.
Figure 1: Python Plot of IQ data in time
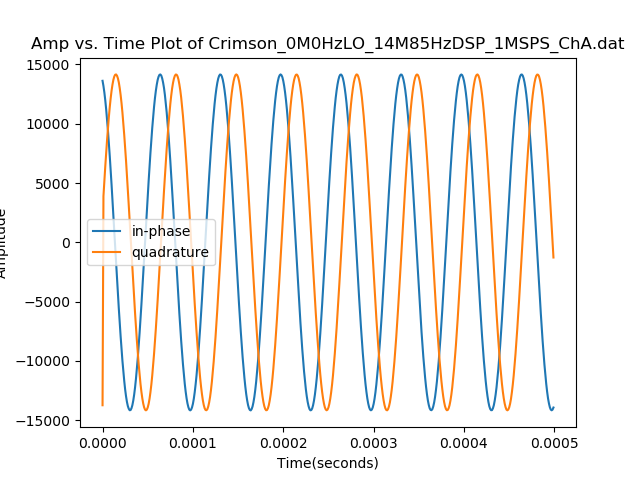
Figure 1: Python Plot of IQ data in time
3. Plotting IQ Data in GNU Octave
To use GNU Octave for plotting IQ data, you will need to add a path to your Octave path variable. More information about this is found here.
In order to parse the data, there are various built-in function to do this. For reading our .dat file, we used the GNU Octave read_cshort_binary function from within the same directory in which we saved the dat file.
The link below shows the path to octave binary functions in case they are not installed could be found here.
#Download this function into the same directory as the data files you would like to read.
wget https://raw.githubusercontent.com/gnuradio/gnuradio/refs/heads/main/gr-utils/octave/read_cshort_binary.m
If using our provided data:
a=read_cshort_binary('Crimson_0M0HzLO_14M85HzDSP_1MSPS_ChA.dat');a=read_cshort_binary('test-samples.dat'); Once the data is loaded into variable a, you can plot it as follows:
x=1:1:length(a);
plot(x,a)