Performance Measurements
Phase Noise Profiles and Spectrum Graphs
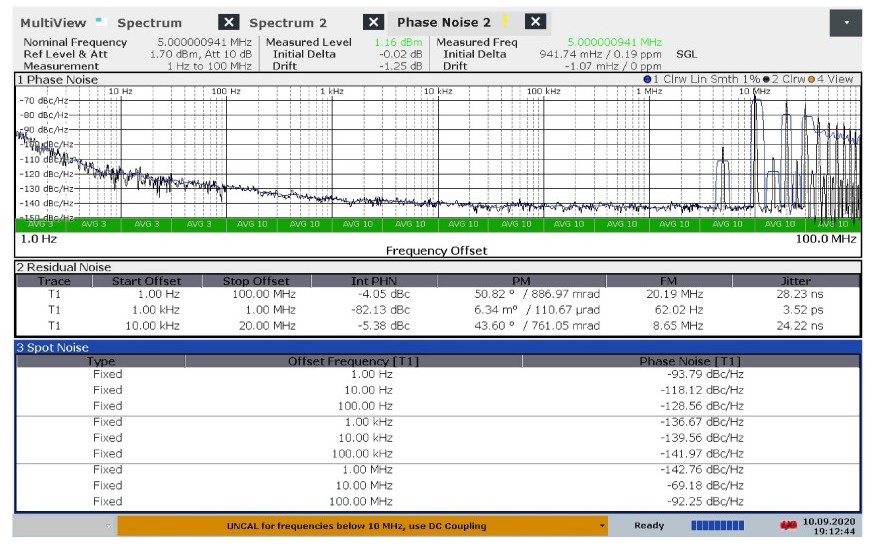
Reference Clock
Test conditions
The Ref Clock is configured with an internal 10 MHz reference. A 50R cable was used to connect Calamine to a Rhode and Swartz FSW Signal and Spectrum Analyzer where we captured the results.
Measurement Results
Figure 1: Phase Noise of Reference Clock
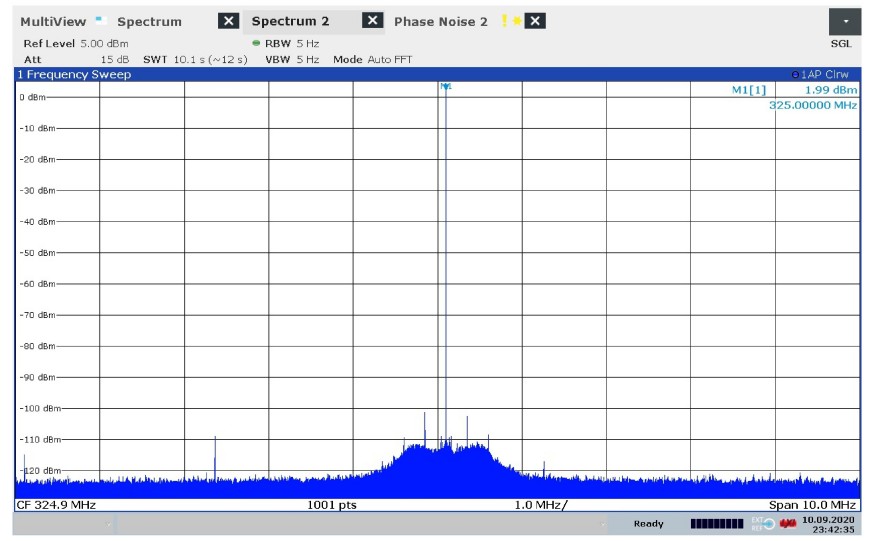
Figure 2: Spectrum of Ref Clock
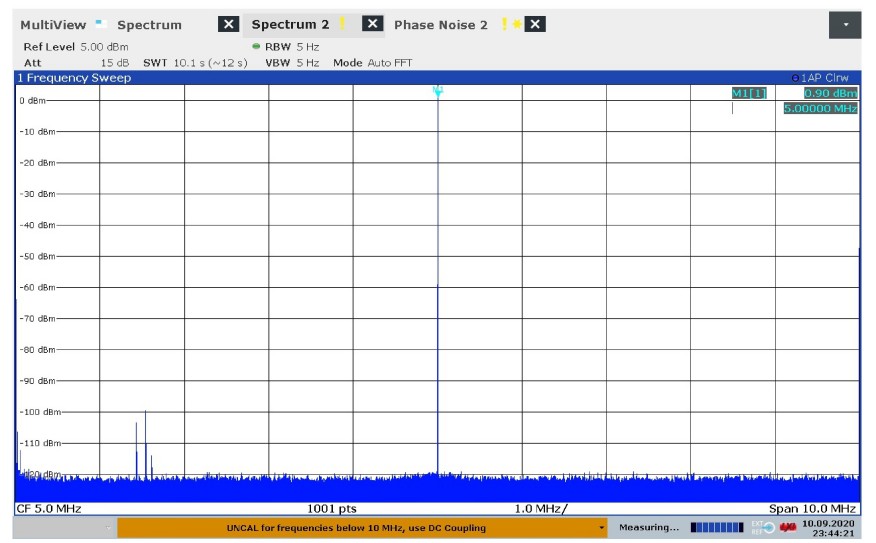
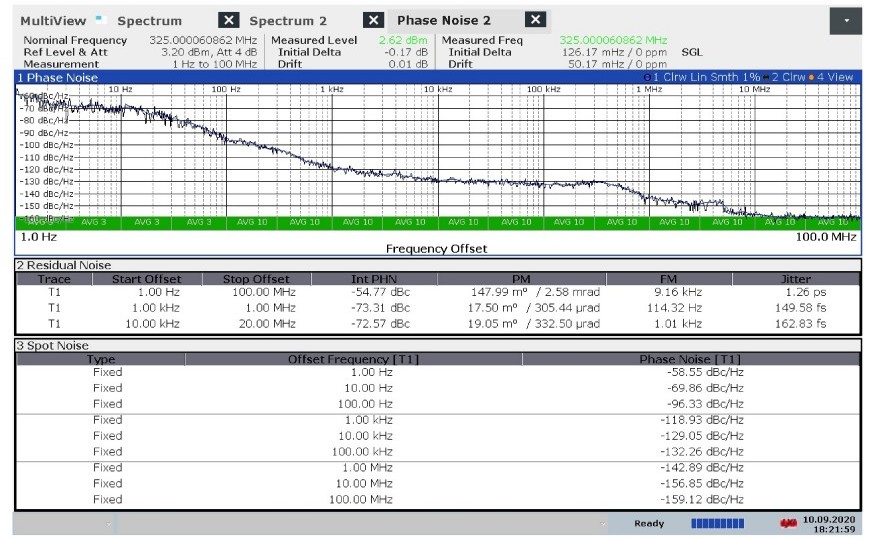
Device Clock
Test conditions
The Dev Clock, used for converters, operates at 300MHz (Configured with internal 10MHz reference). A 50R cable was used to connect Calamine to a Rhode and Swartz FSW Signal and Spectrum Analyzer where we captured the results.
Measurement Results
Figure 3: Phase Noise profile of Dev Clock
Figure 4: Spectrum of Dev Clock
Rx Performance Measurements
For dynamic range, the input power of the signal, and the gain of the SDR, are adjusted to provide a near-fullswing amplitude at the ADC, and the FFT is provided. This aims to provide you with a measurement of dynamic range.
Rx Dynamic Range Measurements
Table 1: Calamine Device Parameter Revision for Dynamic Range.
| Parameter | Revision |
|---|---|
| Hardware | Calamine RTM 1 |
| FPGA | 5613e0864 |
| Server | firmware-stable-t5v10l1-3.6-82-gdfb88839 |
| MCU | mcu-stable-t5v10-3.5-38-g09d262e3 |
| UHD | 4.8.0.15-3373-gf2266da2 |
The following parameters were set for the Rx dynamic range measurements.
Table 2: Calamine Rx Dynamic Range Measurement Parameters & Values
| Parameter | Value |
|---|---|
| Sample Rate | 25MSPS |
| FFT Size | 1024 |
| Sig. Gen. Frequency | SDR Gain (dB) | Peak (dBm) | Mean Noise Floor (dBm) | Dynamic Range (dBm) |
|---|---|---|---|---|
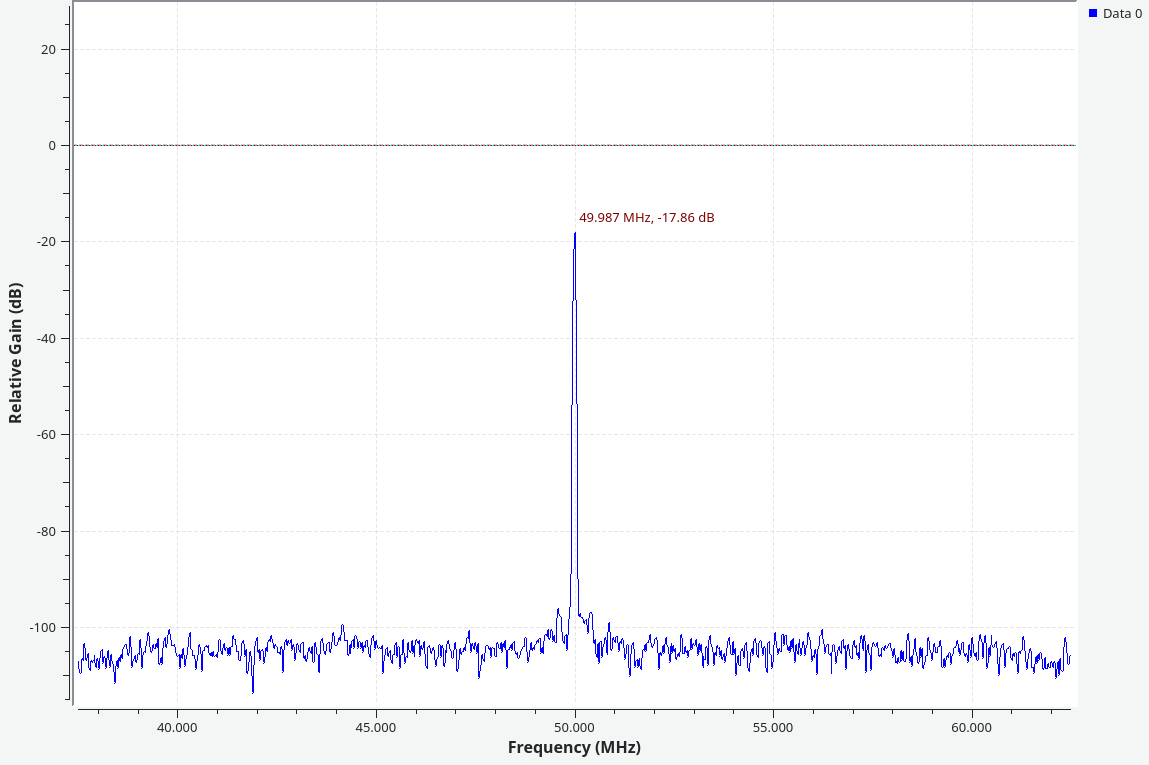
| 50MHz | 31 | -17.86 | -105.21 | 87.35 |
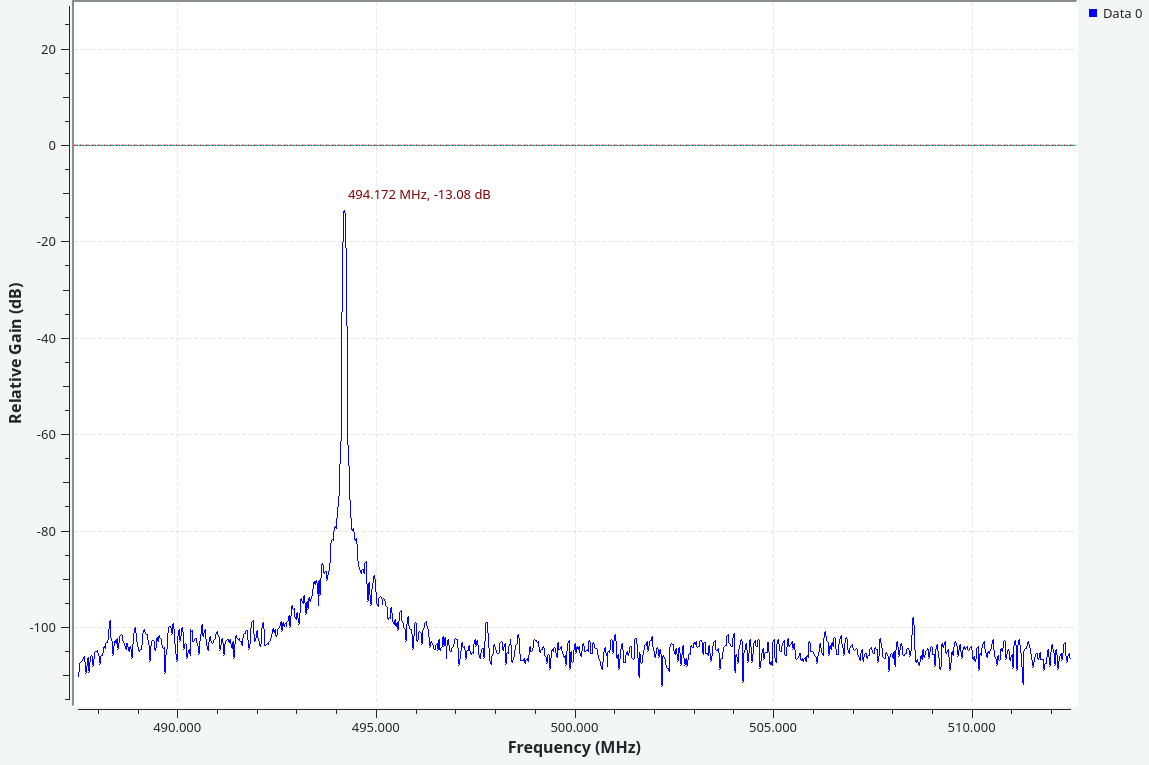
| 500MHz | 60 | -13.08 | -104.59 | 91.51 |
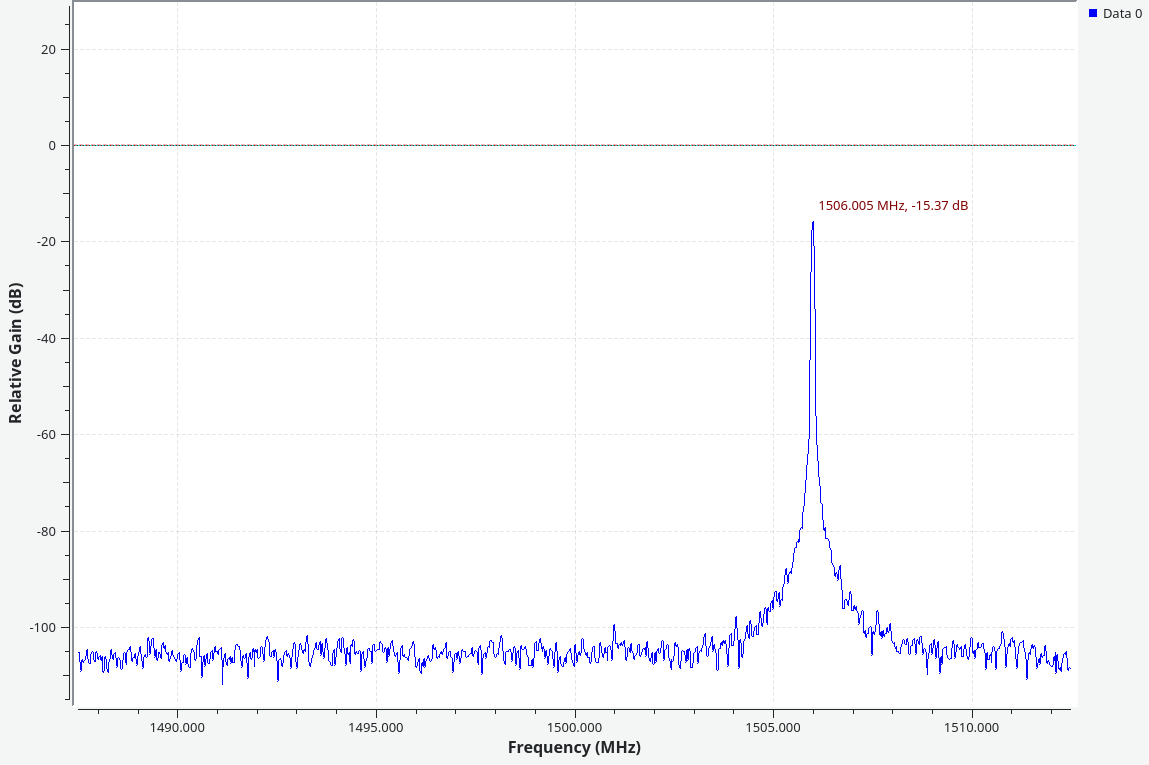
| 1.51GHz | 60 | -15.37 | -105.00 | 89.63 |
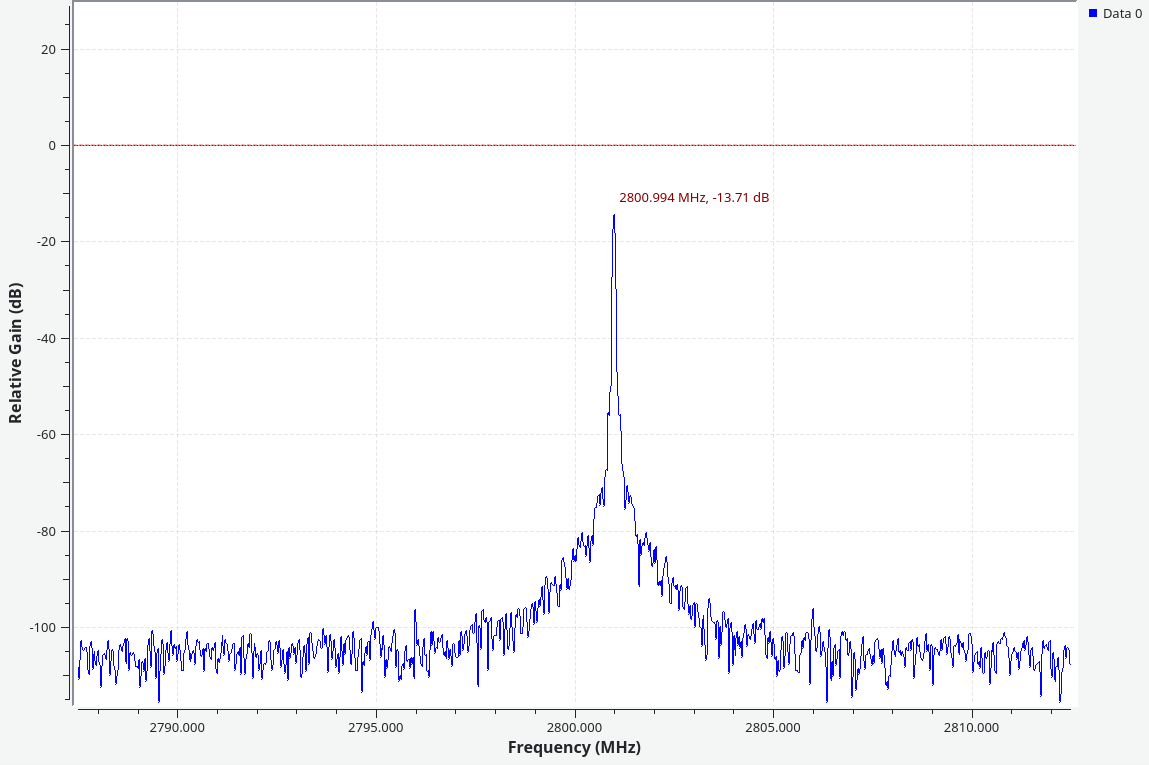
| 2.81GHz | 83 | -13.71 | -104.59 | 90.88 |
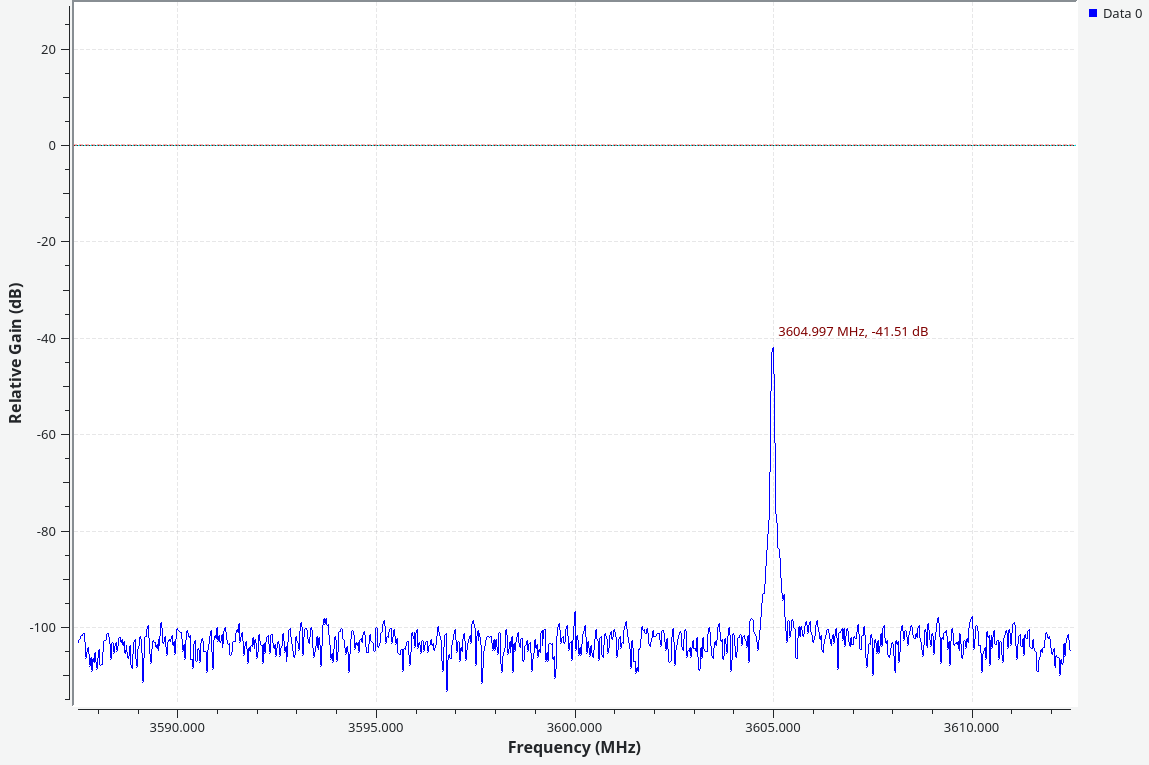
| 3.61GHz | 83 | -41.51 | -103.34 | 61.83 |
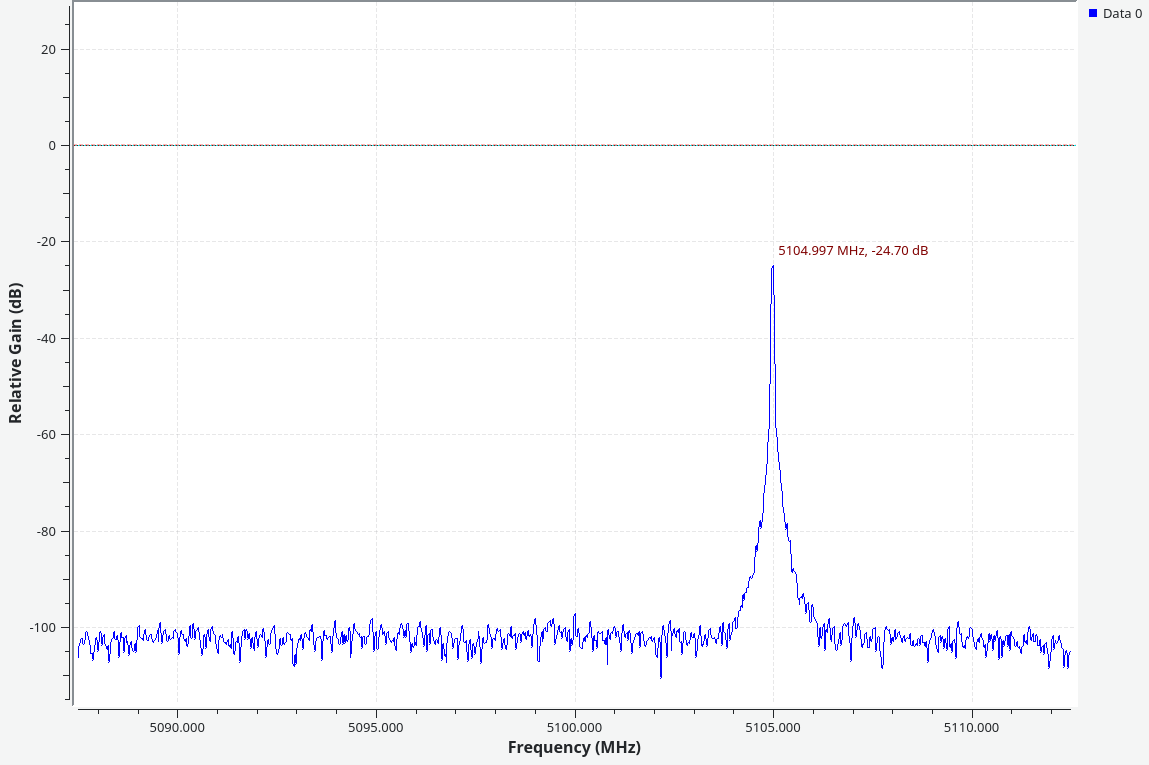
| 5.11GHz | 83 | -24.70 | -103.14 | 78.44 |
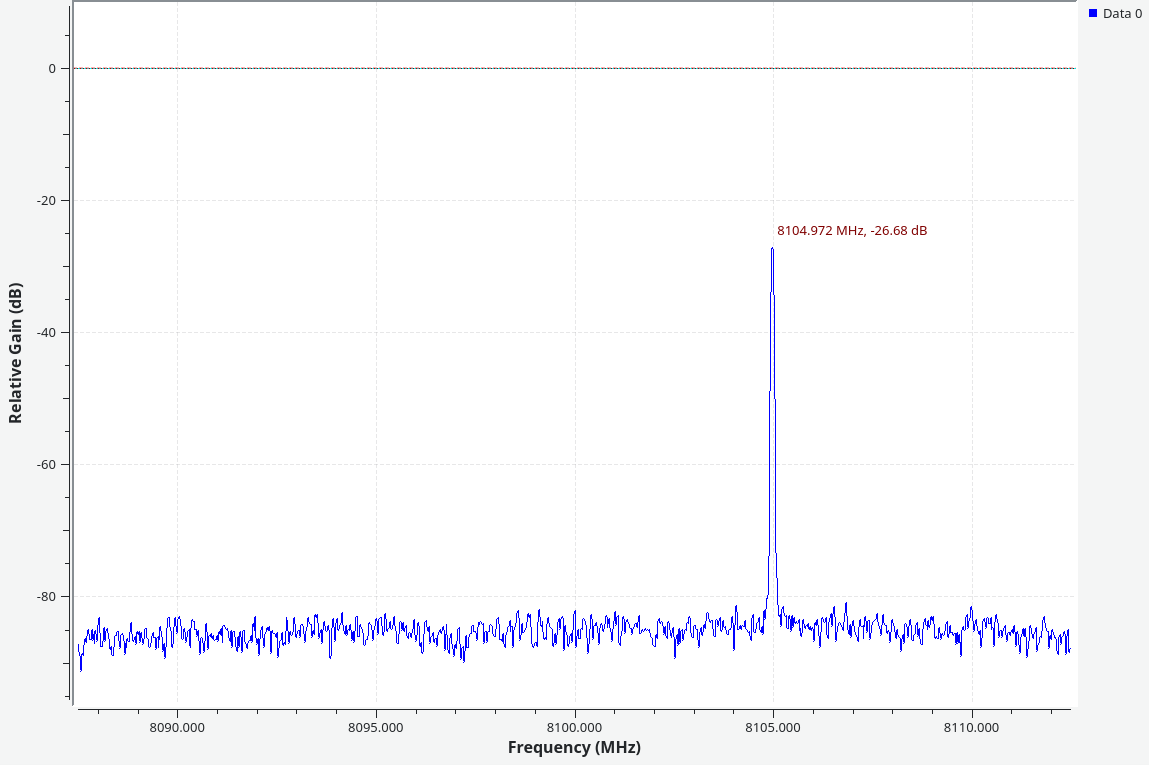
| 8.11GHz | 83 | -26.68 | -83.07 | 56.39 |
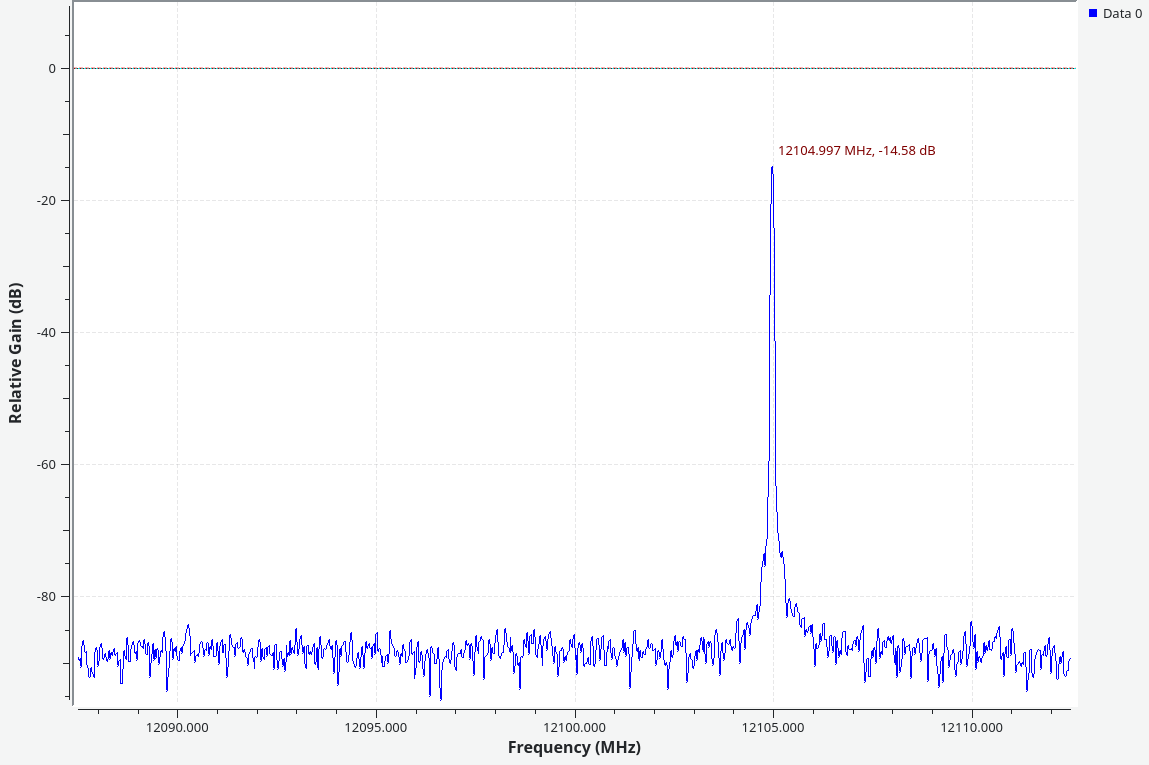
| 12.11GHz | 83 | -14.58 | -88.25 | 73.67 |
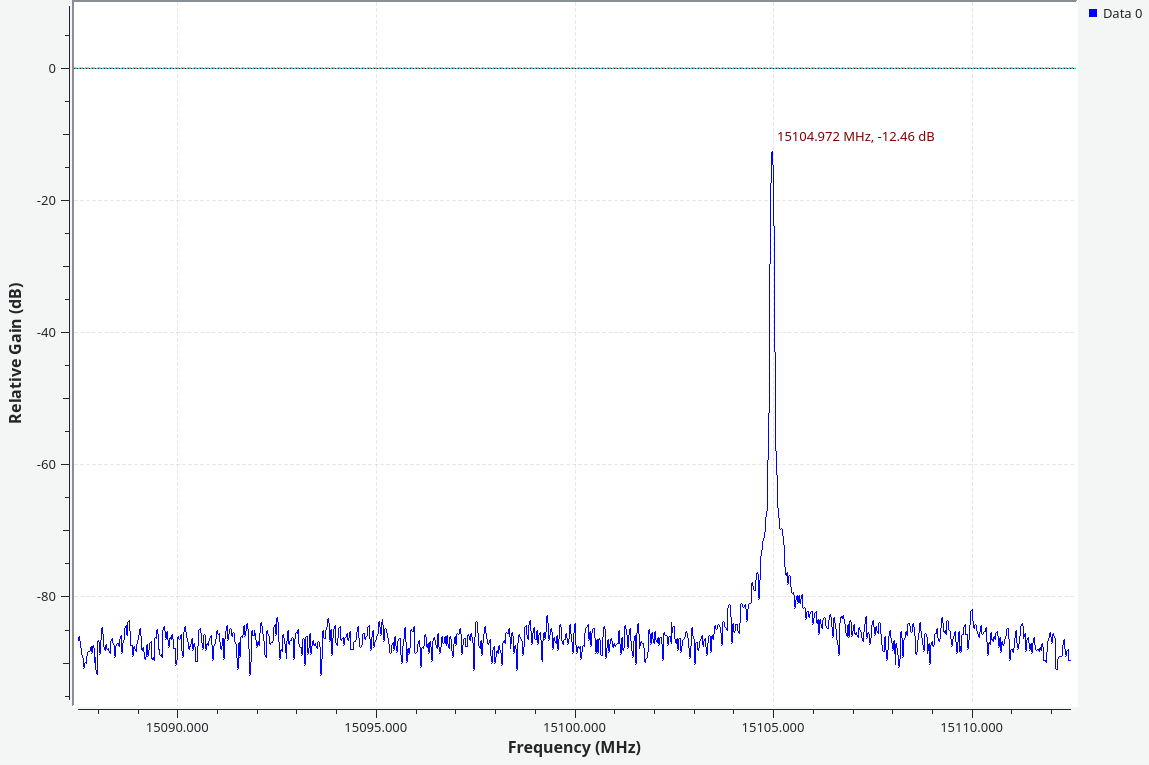
| 15.11GHz | 83 | -12.46 | -86.13 | 73.97 |
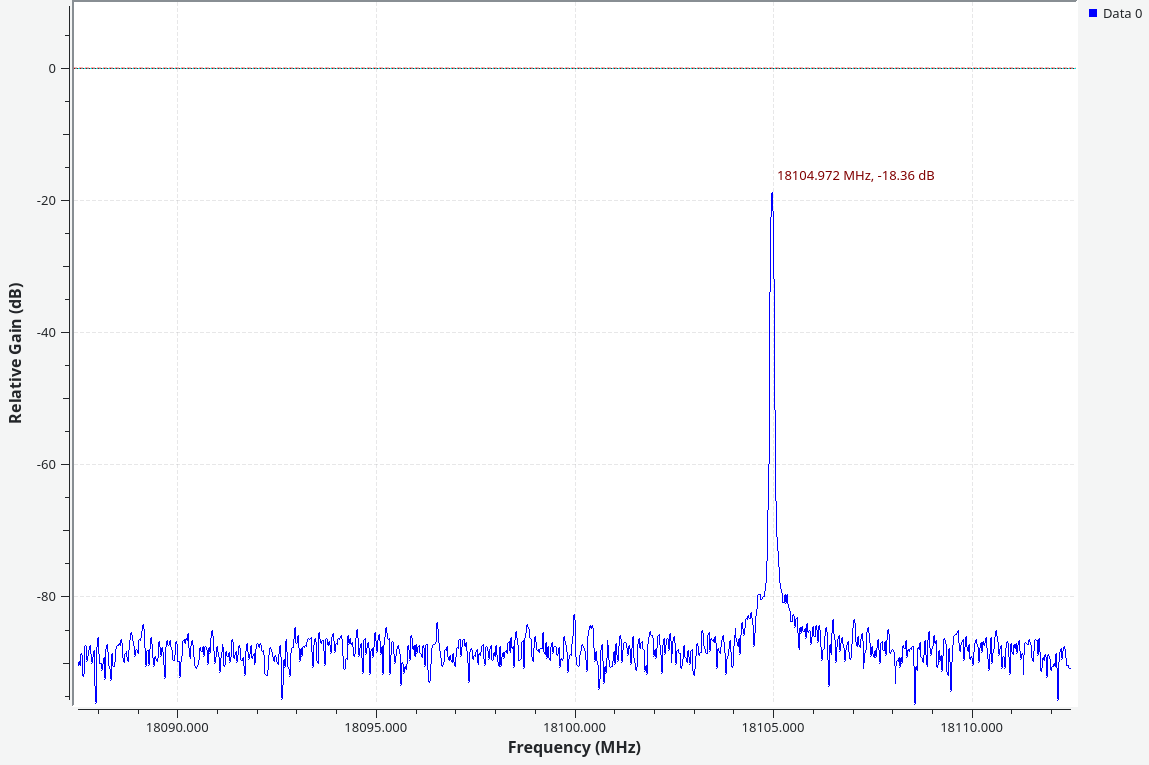
| 18.11GHz | 83 | -18.36 | -88.40 | 70.04 |
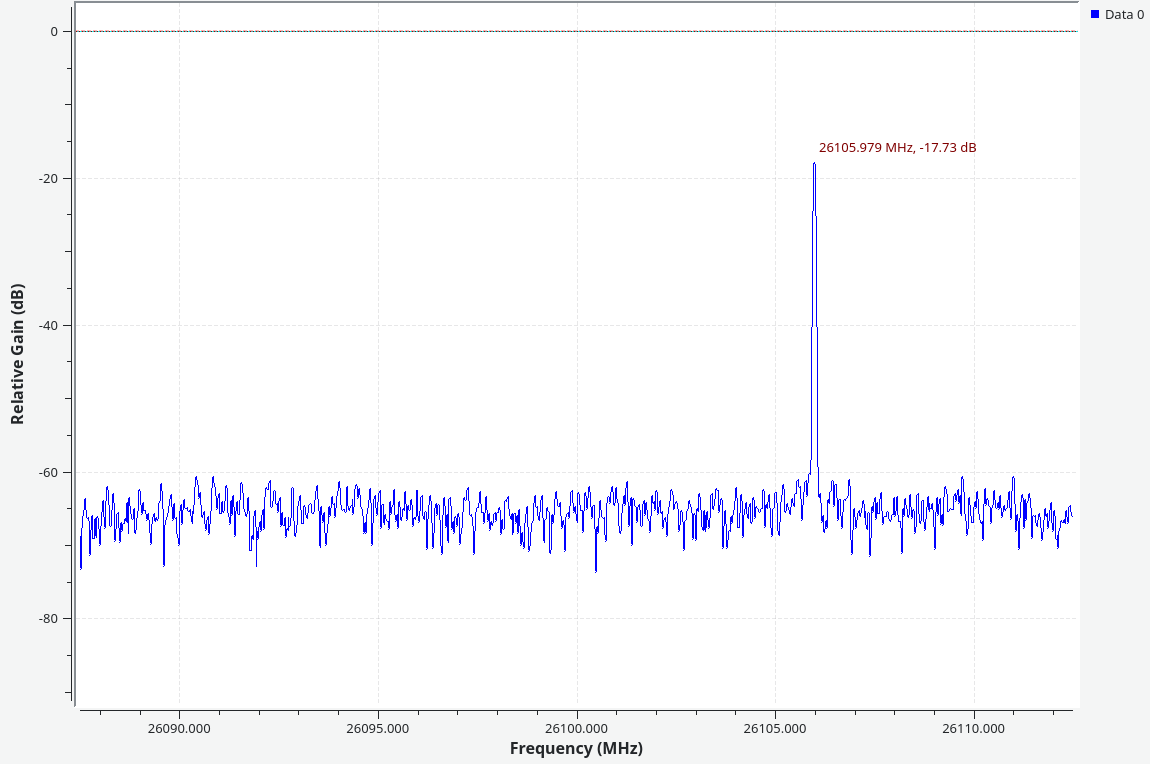
| 26.11GHz | 83 | -17.73 | -65.87 | 48.14 |
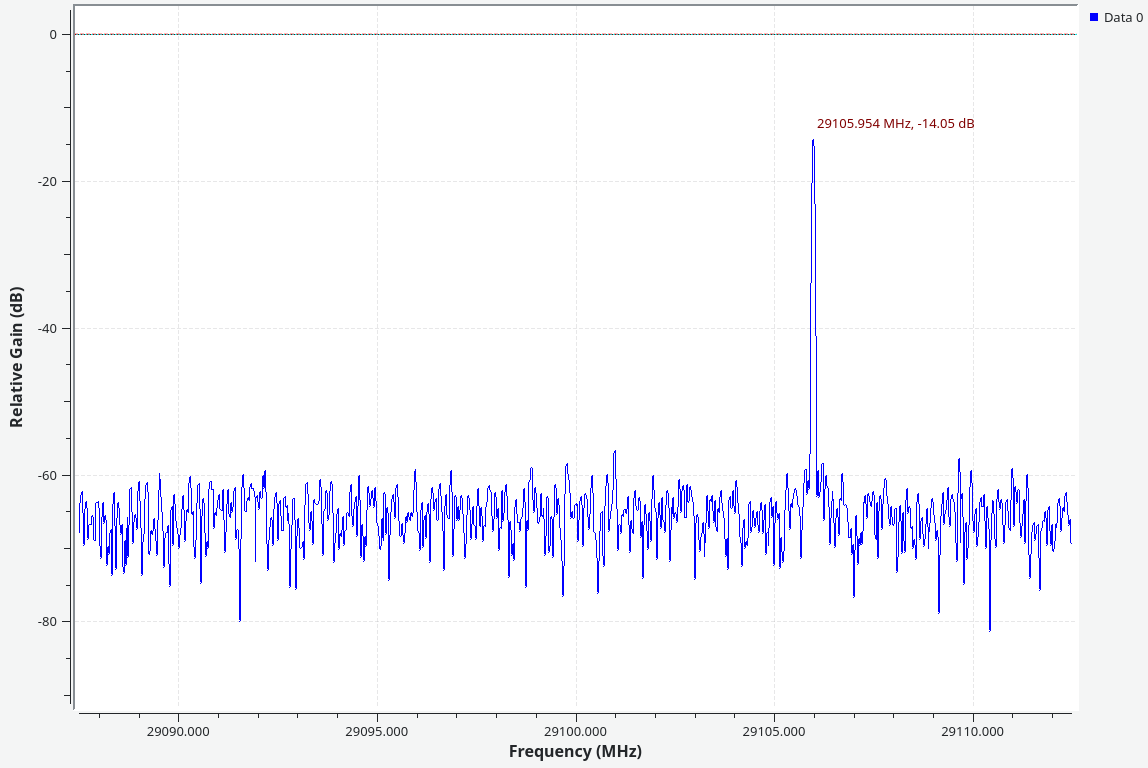
| 29.11GHz | 83 | -14.05 | -68.00 | 53.95 |
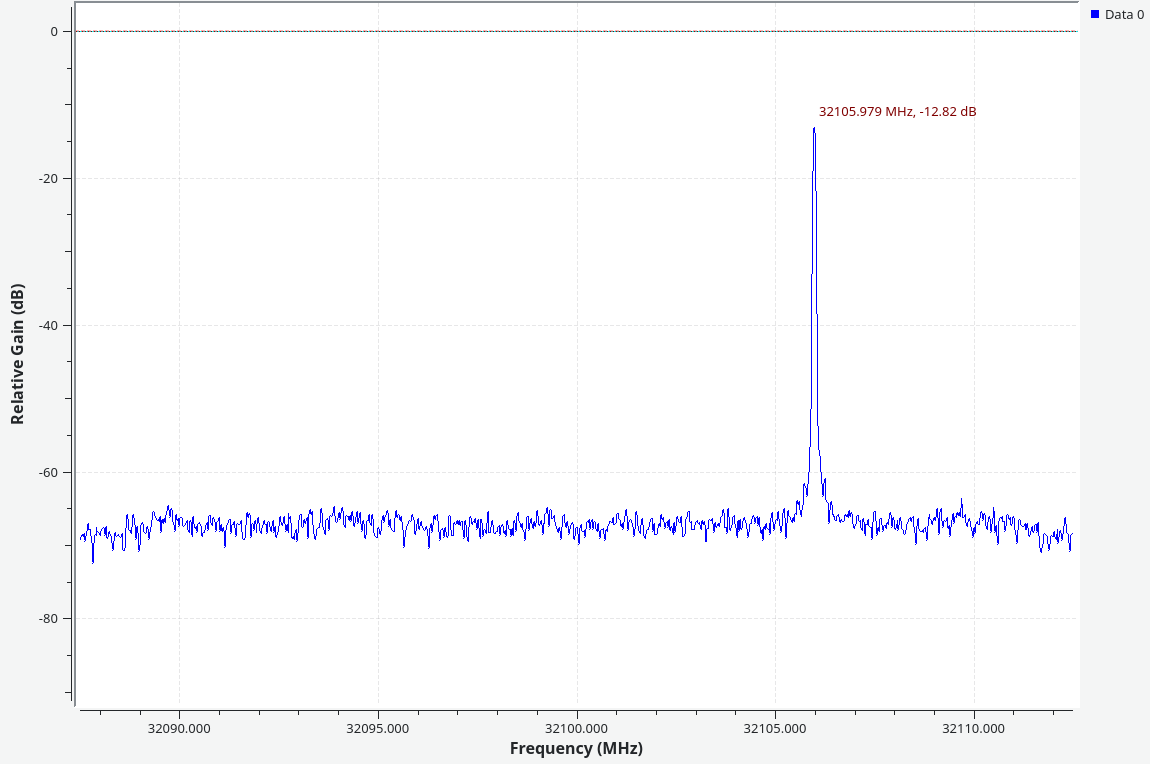
| 32.11GHz | 83 | -12.82 | -68.82 | 56.00 |
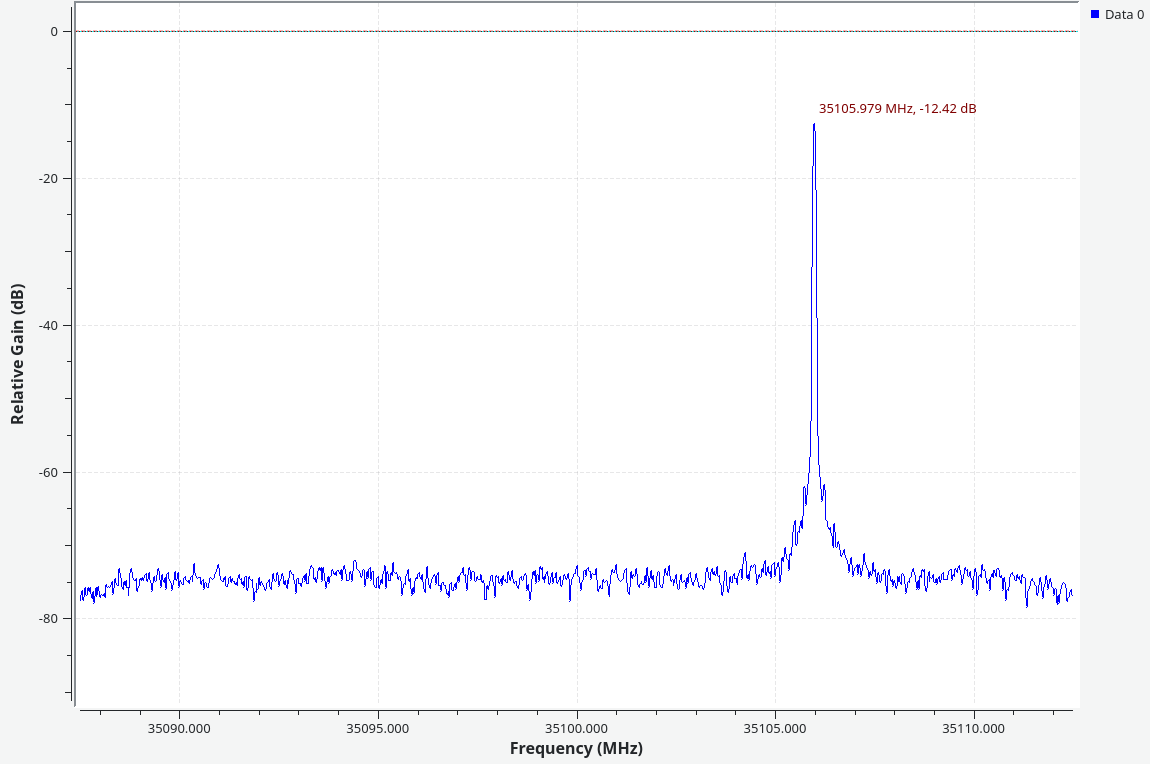
| 35.11GHz | 73 | -12.42 | -75.04 | 62.62 |
| 38.11GHz | 73 | -13.73 | -76.00 | 62.27 |
Test conditions
In the second setup, we generated signals at various frequencies on a signal generator and passed it into Rx Channel A on the Calamine. The signal is captured at full swing using a GNU Radio program, alongside some overrides in the Web UI), where the Rx Gain and Rx Attenuation were set to varying values for each frequency.
Rx Dynamic Range at 50 MHz
Figure 17: Spectrum of 50 MHz Rx Waveform under Max Dynamic Range conditions
Rx Dynamic Range at 495 MHz
Figure 18: Spectrum of 495 MHz Rx Waveform under Max Dynamic Range conditions
Rx Dynamic Range at 1.506 GHz
Figure 19: Spectrum of 1506 MHz Rx Waveform under Max Dynamic Range conditions
Rx Dynamic Range at 2.801 GHz
Figure 20: Spectrum of 2801 MHz Rx Waveform under Max Dynamic Range conditions
Rx Dynamic Range at 3.605 GHz
Figure 21: Spectrum of 3605 MHz Rx Waveform under Max Dynamic Range conditions
Rx Dynamic Range at 5.105 GHz
Figure 22: Spectrum of 5105 MHz Rx Waveform under Max Dynamic Range conditions
Rx Dynamic Range at 8.105 GHz
Figure 23: Spectrum of 8105 MHz Rx Waveform under Max Dynamic Range conditions
Rx Dynamic Range at 12.105 GHz
Figure 24: Spectrum of 12105 MHz Rx Waveform under Max Dynamic Range conditions
Rx Dynamic Range at 15.105 GHz
Figure 25: Spectrum of 15105 MHz Rx Waveform under Max Dynamic Range conditions
Rx Dynamic Range at 18.105 GHz
Figure 26: Spectrum of 18105 MHz Rx Waveform under Max Dynamic Range conditions
Rx Dynamic Range at 26.106 GHz
Figure 27: Spectrum of 26106 MHz Rx Waveform under Max Dynamic Range conditions
Rx Dynamic Range at 29.106 GHz
Figure 28: Spectrum of 29106 MHz Rx Waveform under Max Dynamic Range conditions
Rx Dynamic Range at 32.106 GHz
Figure 29: Spectrum of 32106 MHz Rx Waveform under Max Dynamic Range conditions
Rx Dynamic Range at 35.106 GHz
Figure 30: Spectrum of 35106 MHz Rx Waveform under Max Dynamic Range conditions
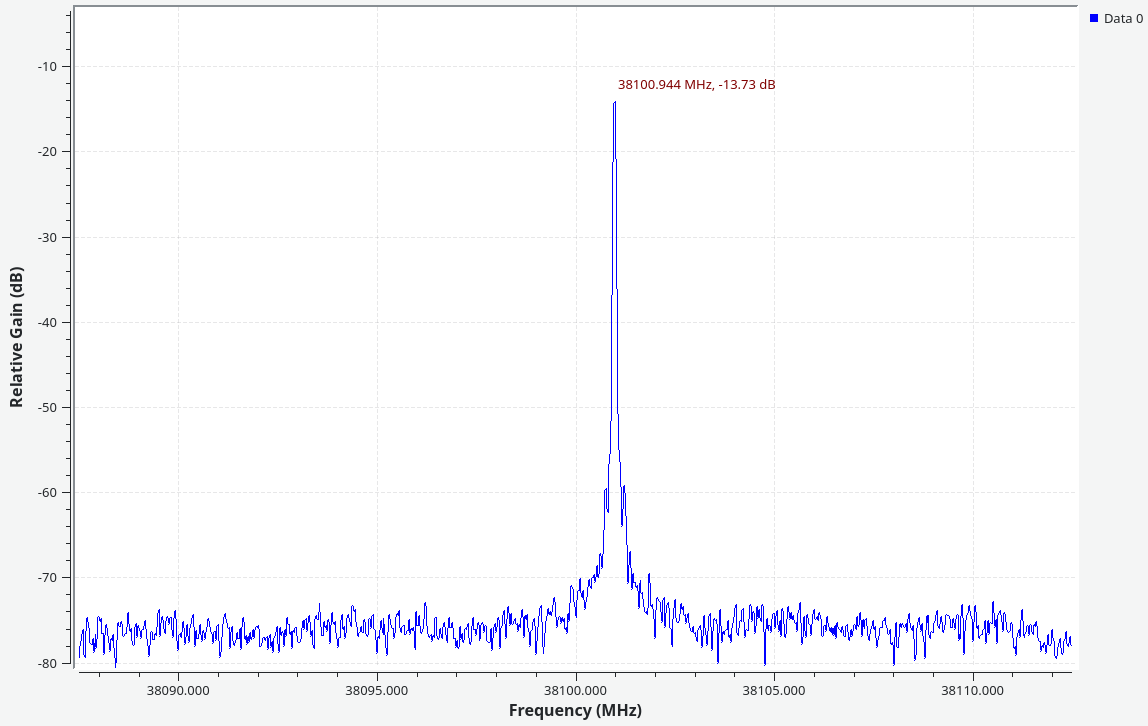
Rx Dynamic Range at 38.101 GHz
Figure 31: Spectrum of 38101 MHz Rx Waveform under Max Dynamic Range conditions