Rx Phase Coherency Checks
Here is a guide on how to write a simple GNU Radio Companion program to test whether the radio waves being received by the Rx chain are in phase with one another.
In this tutorial, we will cover:
- How to check if the Rx front-end boards are in phase with one another using gnuradio
- How to verify that all the front-end boards are in phase with one another using an end-to-end loop-back test performed with gnuradio
This tutorial is going to assume you know how to assemble a simple flow graph with gnuradio. If you haven’t used gnuradio before, you might find our getting started tutorial helpful.
Note
You can find a copy of the code for this tutorial here.
Requirements
Hardware Requirements
- 1 x Crimson TNG (Cyan works just as well)
- 5 x SMA Cables (4 will suffice for the end-to-end test)
- 1 x Signal Generator
Software Requirements
Make sure you have the following programs installed. If you don’t have them installed yet, stop everything and go install them now. You can find the instructions to install them here.
- The Per Vices’ version of libUHD
- gnuradio v3.7.13.4
Note
Most of the common package managers (like apt-get, brew, pacman) have a different version of UHD. Make sure you compile the Per Vices supported version from scratch
Experimental Setup
In order to check the phase coherency of the Crimson Rx Channels, we will generate a 15 MHz signal from our signal generator and use the 4-to-1 SMA splitter to receive it on all the Rx Inputs. Once we receive the incoming signal, we will be able to use GNU radio to graph its phase.
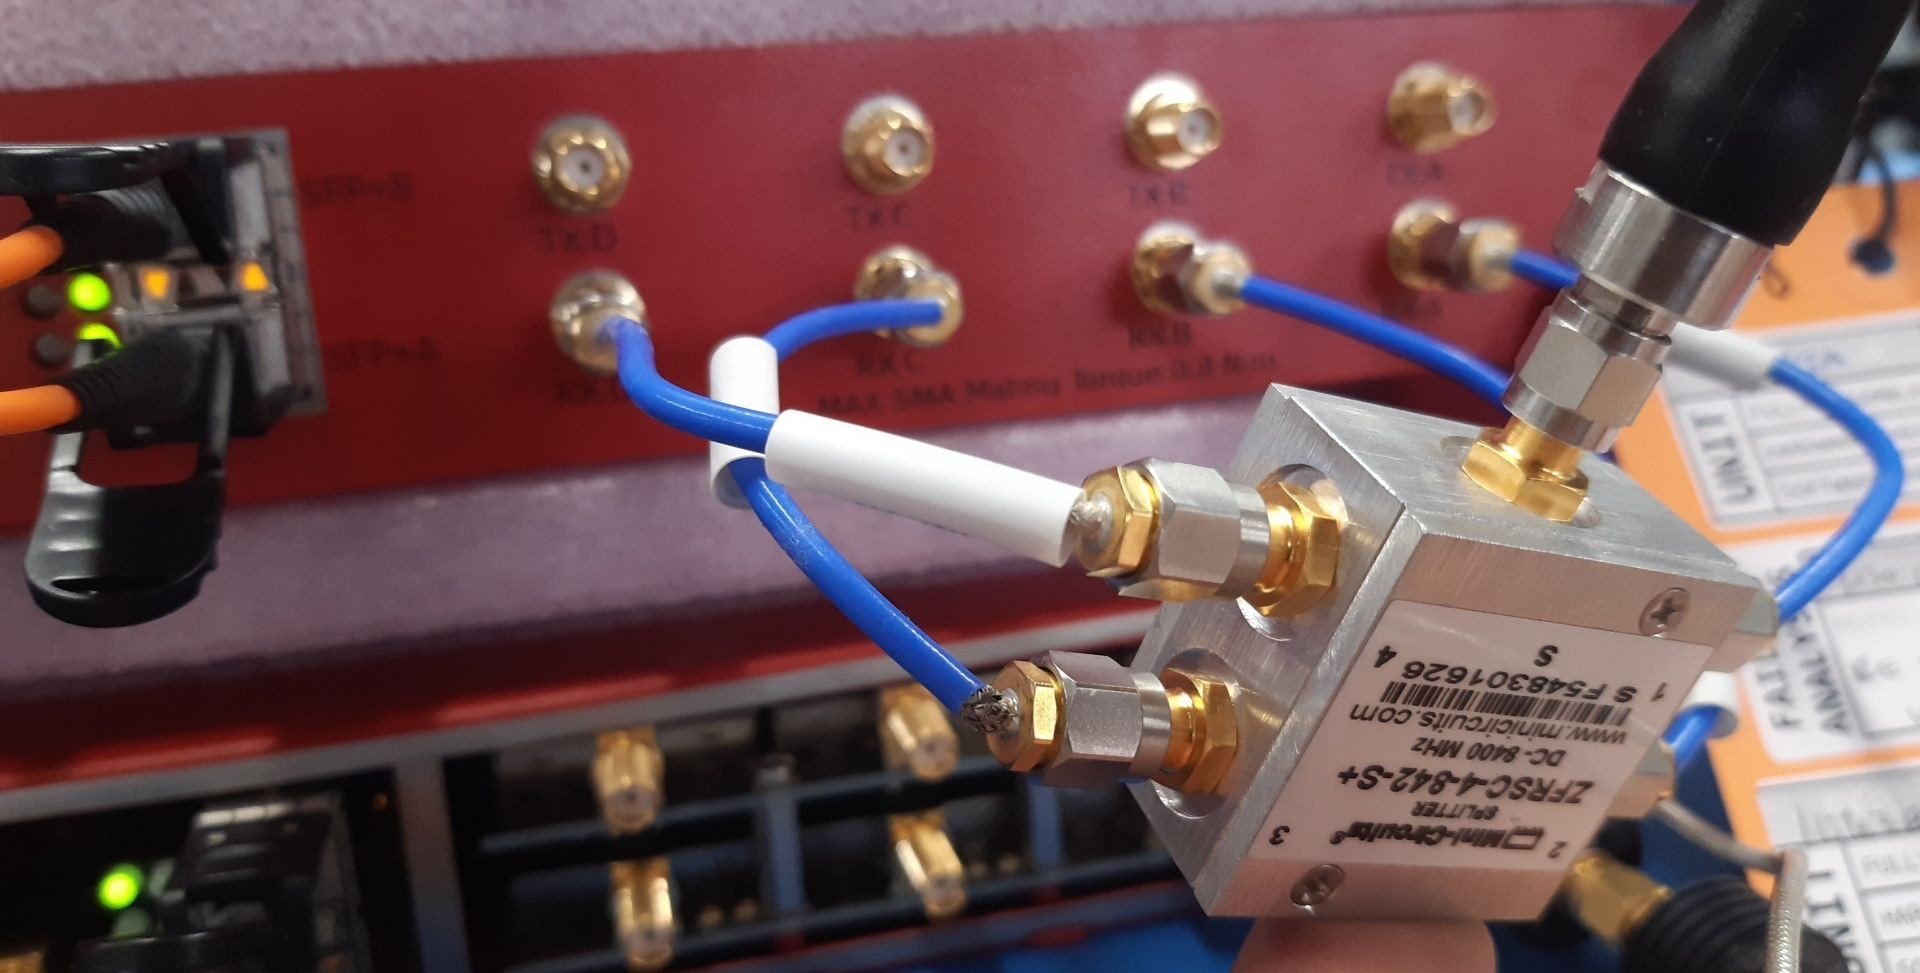
The 4-to-1 SMA splitter is used feed the input from the signal generator to all of the Rx ports.
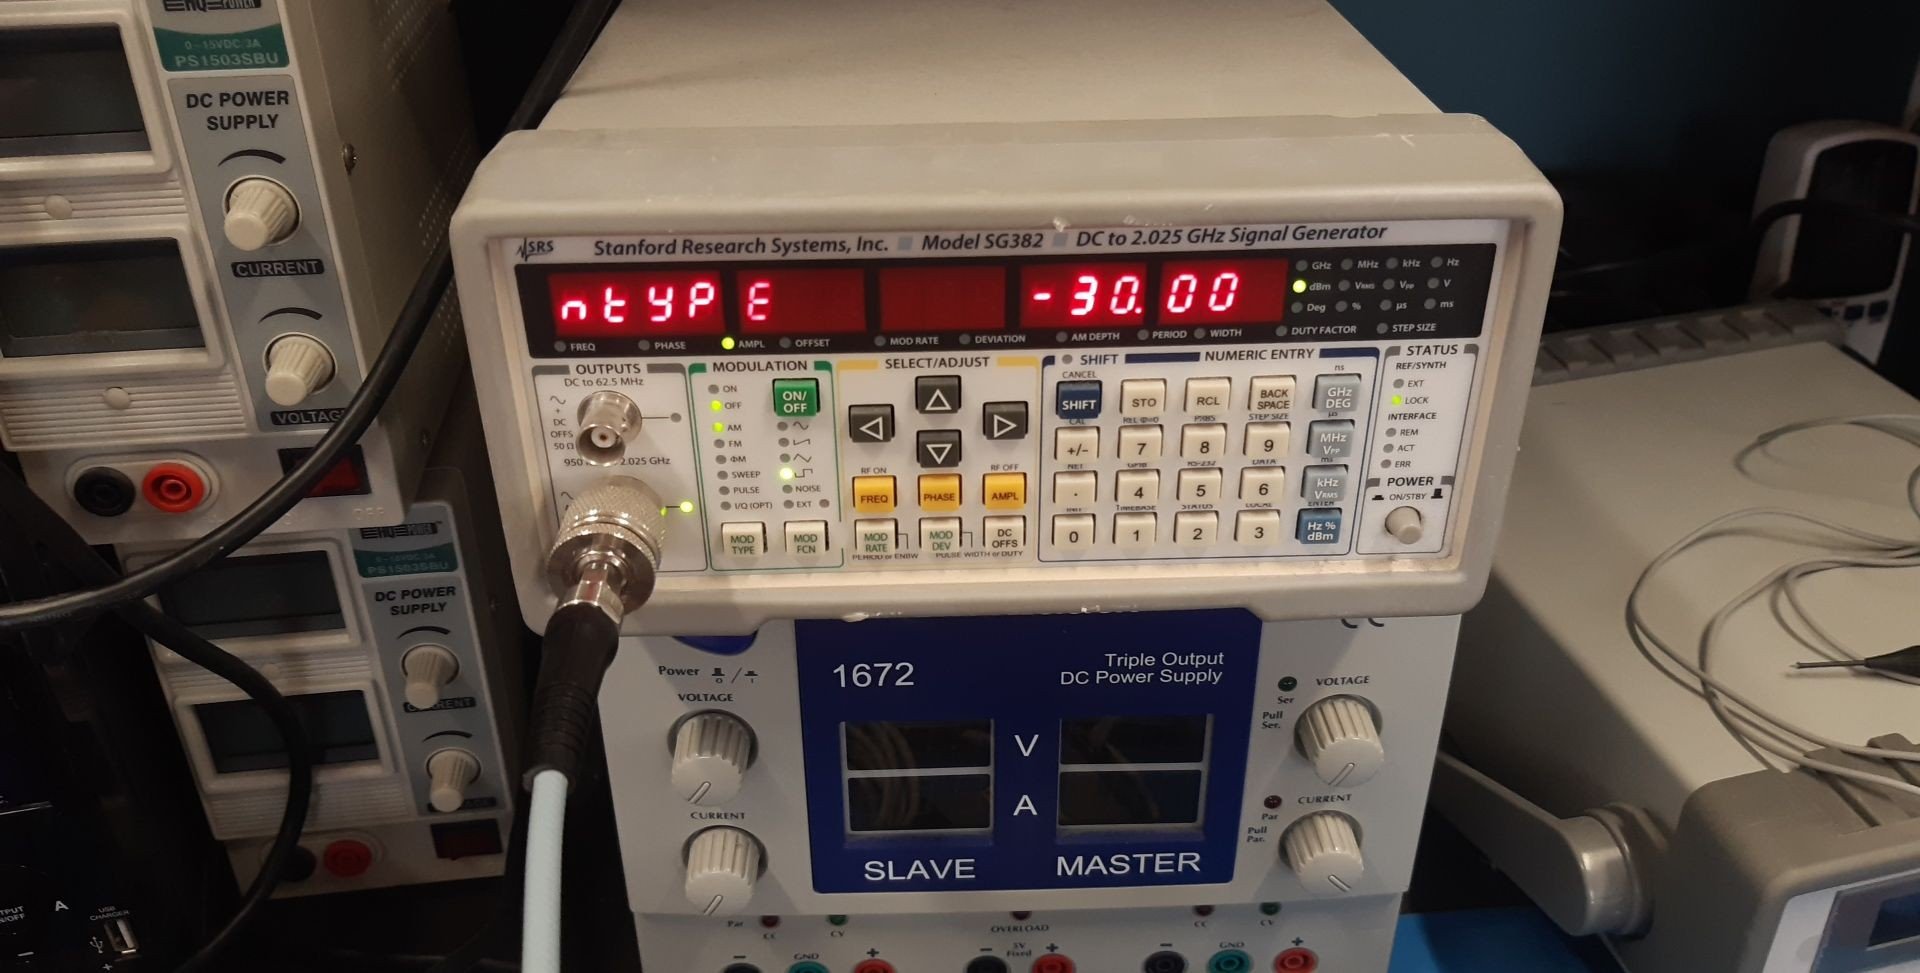
The signal generator is set to generate a 15 MHz sine wave with a signal strength of -30 dBm.
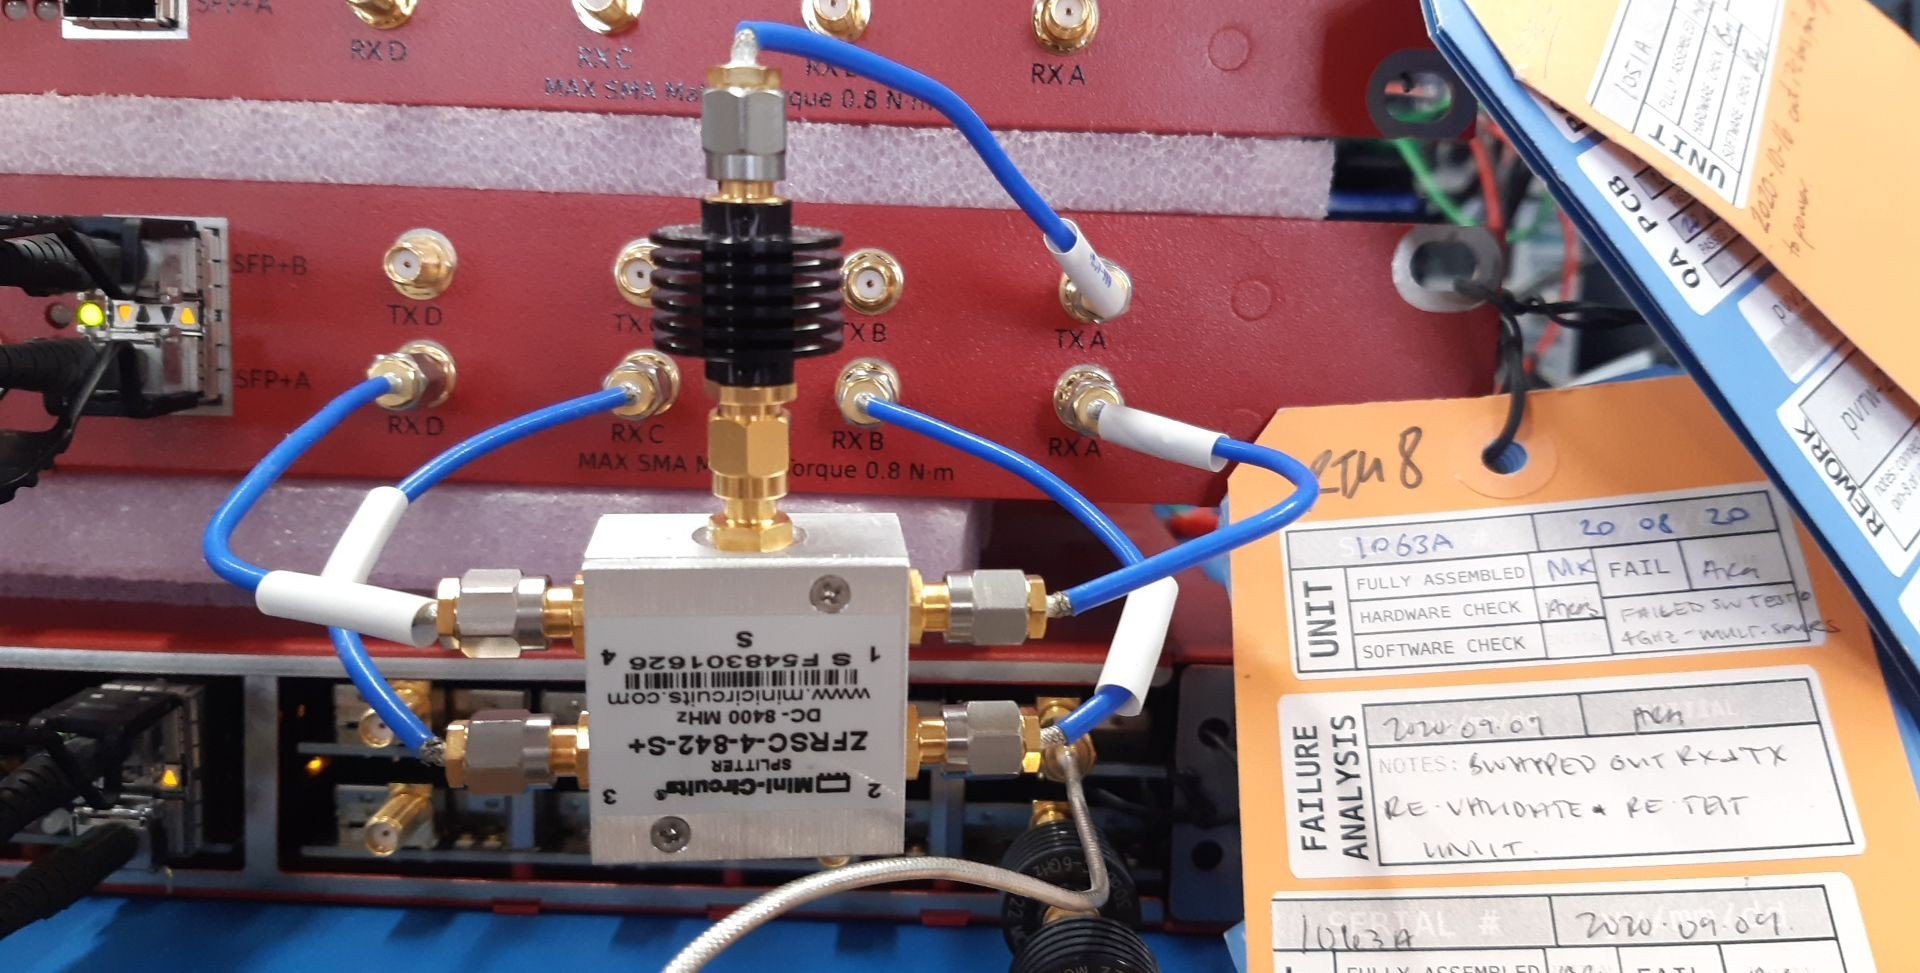
Loop back Setup
Once you have verified that the Rx Channels are in-phase using the signal generator, it’s a good idea to also verify the phase coherency using the Tx channels of the radio. To do this, we can use any of the Tx ports on the Crimson in place of the Signal Generator. To do this, we simply need to move the SMA cable connected to the input of the 4-to-1 signal splitter from the signal generator to a Tx port.
Creating a new gnuradio project
Let’s start by giving our project a descriptive name in the Options block
| key | value | comments |
|---|---|---|
| ID | rx_phase_coherence_test | this is the name of the python program that gets generated |
| Generate Options | QT GUI | |
| Max Number of Outputs | 1.6 k |
Overview of the flow graph
Now we can start assembling our flow graph. Our gnuradio program will have three parts:
- The variables and view parameters
- The Tx chain
- The Rx chain
Variables and View Parameters
All the front-end boards will send and receive identical waves. Abstracting these values out is a nice way to ensure that they will stay consistent across all the boards.
| key | value |
|---|---|
| samp_rate | 1 M |
| signal_freq | 15k |
| tx_center_freq | 15 M |
| rx_center_freq | tx_center_freq - signal_freq |
| npoints | 64 |
Function Probes
We will need to create FOUR labels and FOUR function probes. Here is how each one should look:
| key | value |
|---|---|
| ID | Mag Label A |
| Label | Mag A |
| Default Value | -infG |
| key | value |
|---|---|
| ID | probeFuncA |
| Block ID | magProbA |
| Function Name | level |
| Function Args | |
| Poll Rate (Hz) | 10 |
| Initial Value | 0 |
We will want to create similar blocks for the remaining Rx Chains: B, C and D. These probes will provide us with a number that indicates how different the amplitude of each wave is from one another.
Transmit Chain
In order to check phase coherency, we will need a radio signal to use as input. We can setup the signal source in one of two ways. If you are using the signal generator as input, you can skip this part. Otherwise we will need to use gnuradio to setup the signal source that we will then hook up our USRP device.
If you are feeling a little more ambitious, you can also check the phase coherency of the entire radio (both the Rx chains and the Tx chains) by connecting SMA cables from each of the Tx ports to the corresponding Rx ports. This requires us to make one small change: We will need to modify the number of channels in the UHD: USRP Sync block to accept (four) 4 inputs instead.
Signal Source Parameters
| key | value | Comment |
|---|---|---|
| id | analog_sig_source_x_0 |
|
| Output Type | Complex | |
| Sample Rate | samp_rate |
15 k |
| Waveform | sine | |
| Frequency | freq_all |
1 M |
| Amplitude | amp_all |
30 k |
| Offset | 0 |
Since our sample rate is set to 1 MSPS, we know from the sampling theorem that we can a frequency of at most 500 k. By using a lower frequency (like 15 kHz as suggested in the table above) we can collect more samples.
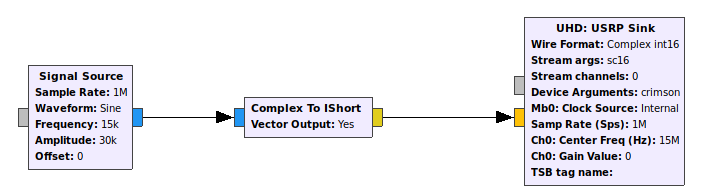
Great! Now we will want to connect it to our radio which is represented using a USRP Sink Block.
Note
The USRP blocks that are used to interface with the radio accept inputs as IShort. To account for this, We will need to use the “Complex to IShort” converter block to convert the Signal source to the USRP Sink.
USRP Sink Block Parameters
| key | value |
|---|---|
| ID | uhd_usrp_sink_0_0_3_0 |
| Input Type | Complex int16 |
| Stream args | sc16 |
| Stream Channels | [0, 1, 2, 3] |
| Dev Address | |
| Dev Args | “crimson” |
| Sync | don’t sync |
| Clock Rate | 120 MHz |
| Num Mboards | 1 |
| Mb0: Clock Source | Internal |
| Mb0: Time Source | Default |
| Mb0: Subdev Spec | |
| Num Channels | 1 |
| Samp Rate | samp_rate |
Channel Parameters
These are set in the RF Options Tab:
| key | value |
|---|---|
| CH0: Center Freq | center_freq |
| Ch0: Gain Value | 0 |
| Gain Type | Absolute dB |
| Ch0: Antenna | |
| Ch0: Bandwidth | 0 |
Receive Chain
Now that we have a signal being generated, we will need to put some of the plumbing in place to make sure we can receive it properly. The 4-to-1 SMA splitter is going to ensure that there is minimal delay between when the Rx Channels receive the signals. Our job here is to collect the outputs and compare them with each other.
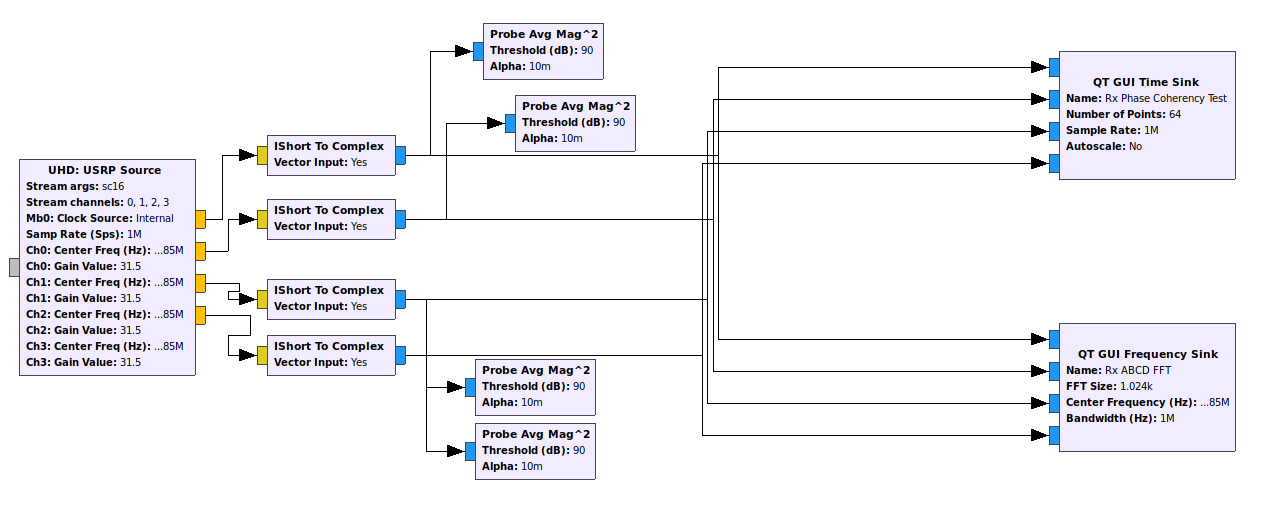
Note
The USRP blocks that are used to interface with the radio outputs IShort values while we went to display the output in our time-sinks using real values. To account for this, we will need to use the “Complex to IShort” converter block to convert the signal source to the USRP sink.
USRP Source
For the receive chain, we will start with a USRP Source block that will sample the incoming signal on all the channels and display the values.
| key | value |
|---|---|
| ID | uhd_usrp_source_0_0 |
| Output Type | Complex int16 |
| Wire Format | Automatic |
| Stream Args | sc16 |
| Stream channels | [0, 1, 2, 3] |
| Device Address | |
| Device Arguments | |
| Sync | don’t sync |
| Clock Rate | Default |
| Num Mboards | 1 |
| Mb0: Clock Source | Internal |
| Mb0: Time Source | Default |
| Mb0: Subdev Spec | |
| Num Channels | 4 |
| Sample Rate (Sps) | samp_rate |
Probe Avg Mag^2
These blocks will help display the actual amplitude of the wave.
| key | value |
|---|---|
| id | magprobeA |
| type | complex |
| threshold (db) | 90 |
| alpha | 0.01 |
| key | value |
|---|---|
| id | magprobeB |
| type | complex |
| threshold (db) | 90 |
| alpha | 0.01 |
| key | value |
|---|---|
| id | magprobeC |
| type | complex |
| threshold (db) | 90 |
| alpha | 0.01 |
| key | value |
|---|---|
| id | magprobeD |
| type | complex |
| threshold (db) | 90 |
| alpha | 0.01 |
QT GUI Time Sink
| key | value |
|---|---|
| ID | qtgui_time_sink_x_0 |
| Type | Complex |
| Name | “Rx Phase Coherency Test” |
| Y Axis Label | Amplitude |
| Y Axis Unit | ”“ |
| Number of Points | npoints |
| Sample Rate | samp_rate |
| Grid | Yes |
| Autoscale | No |
| Y min | -32000 |
| Y max | 32000 |
| Number of Inputs | 4 |
| Update Period | 0.1 |
QT GUI Frequency Sink
| key | value |
|---|---|
| ID | qtgui_time_sink_x_0 |
| Type | Complex |
| Name | “Rx Phase Coherency FFT” |
| FFT Size | 1024 |
| Window Type | Blackman Harris |
| Center Frequency | center_freq |
| Bandwidth | samp_rate |
| Grid | Yes |
| Autoscale | No |
| Y min | -96 |
| Y max | 80 |
| Y label | Relative Gain |
| Y units | dB |
| Number of Inputs | 4 |
| Update Period | 0.10 |
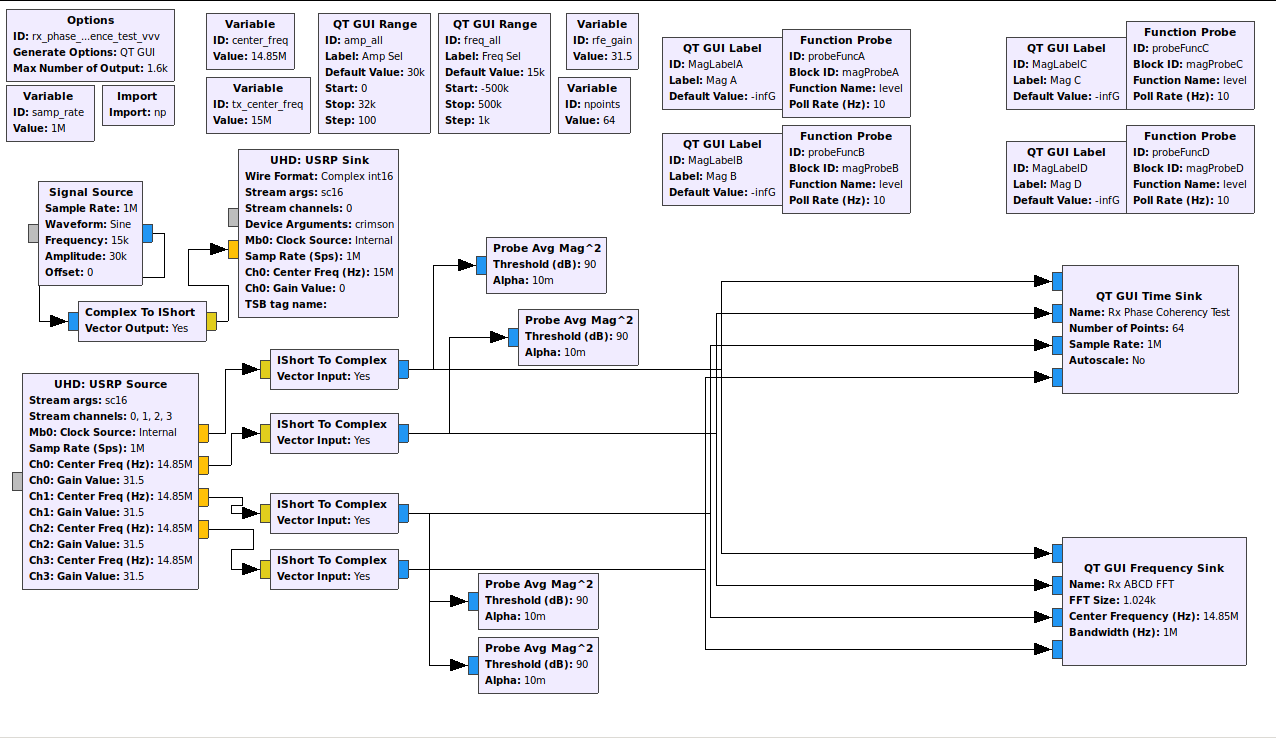
Final Flow Graph
Results
Once you compile and run the program, you should be able to see results that resemble the image shown below. Despite the Sinks having four inputs each, we only see two distinct cures in our graph. This indicates that all the sink inputs (ie. Our Rx Channels) are in sync with one another.
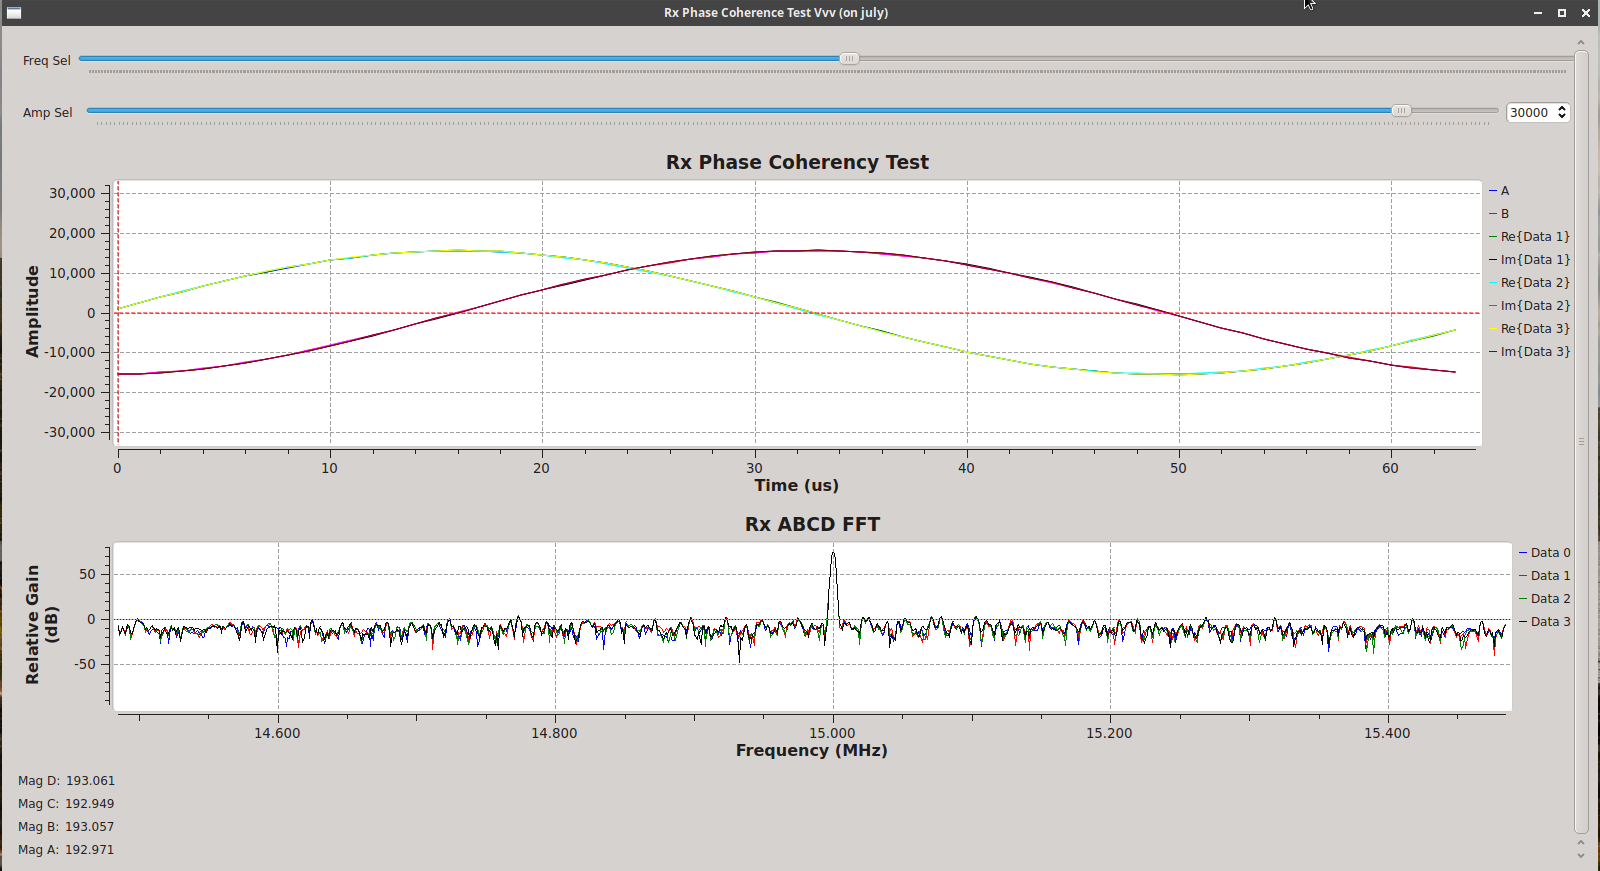
You can now be confident that all the Rx Channels of your SDR are in phase with one another!